966
Proceedings of the 18
th
International Conference on Soil Mechanics and Geotechnical Engineering, Paris 2013
Proceedings of the 18
th
International Conference on Soil Mechanics and Geotechnical Engineering, Paris 2013
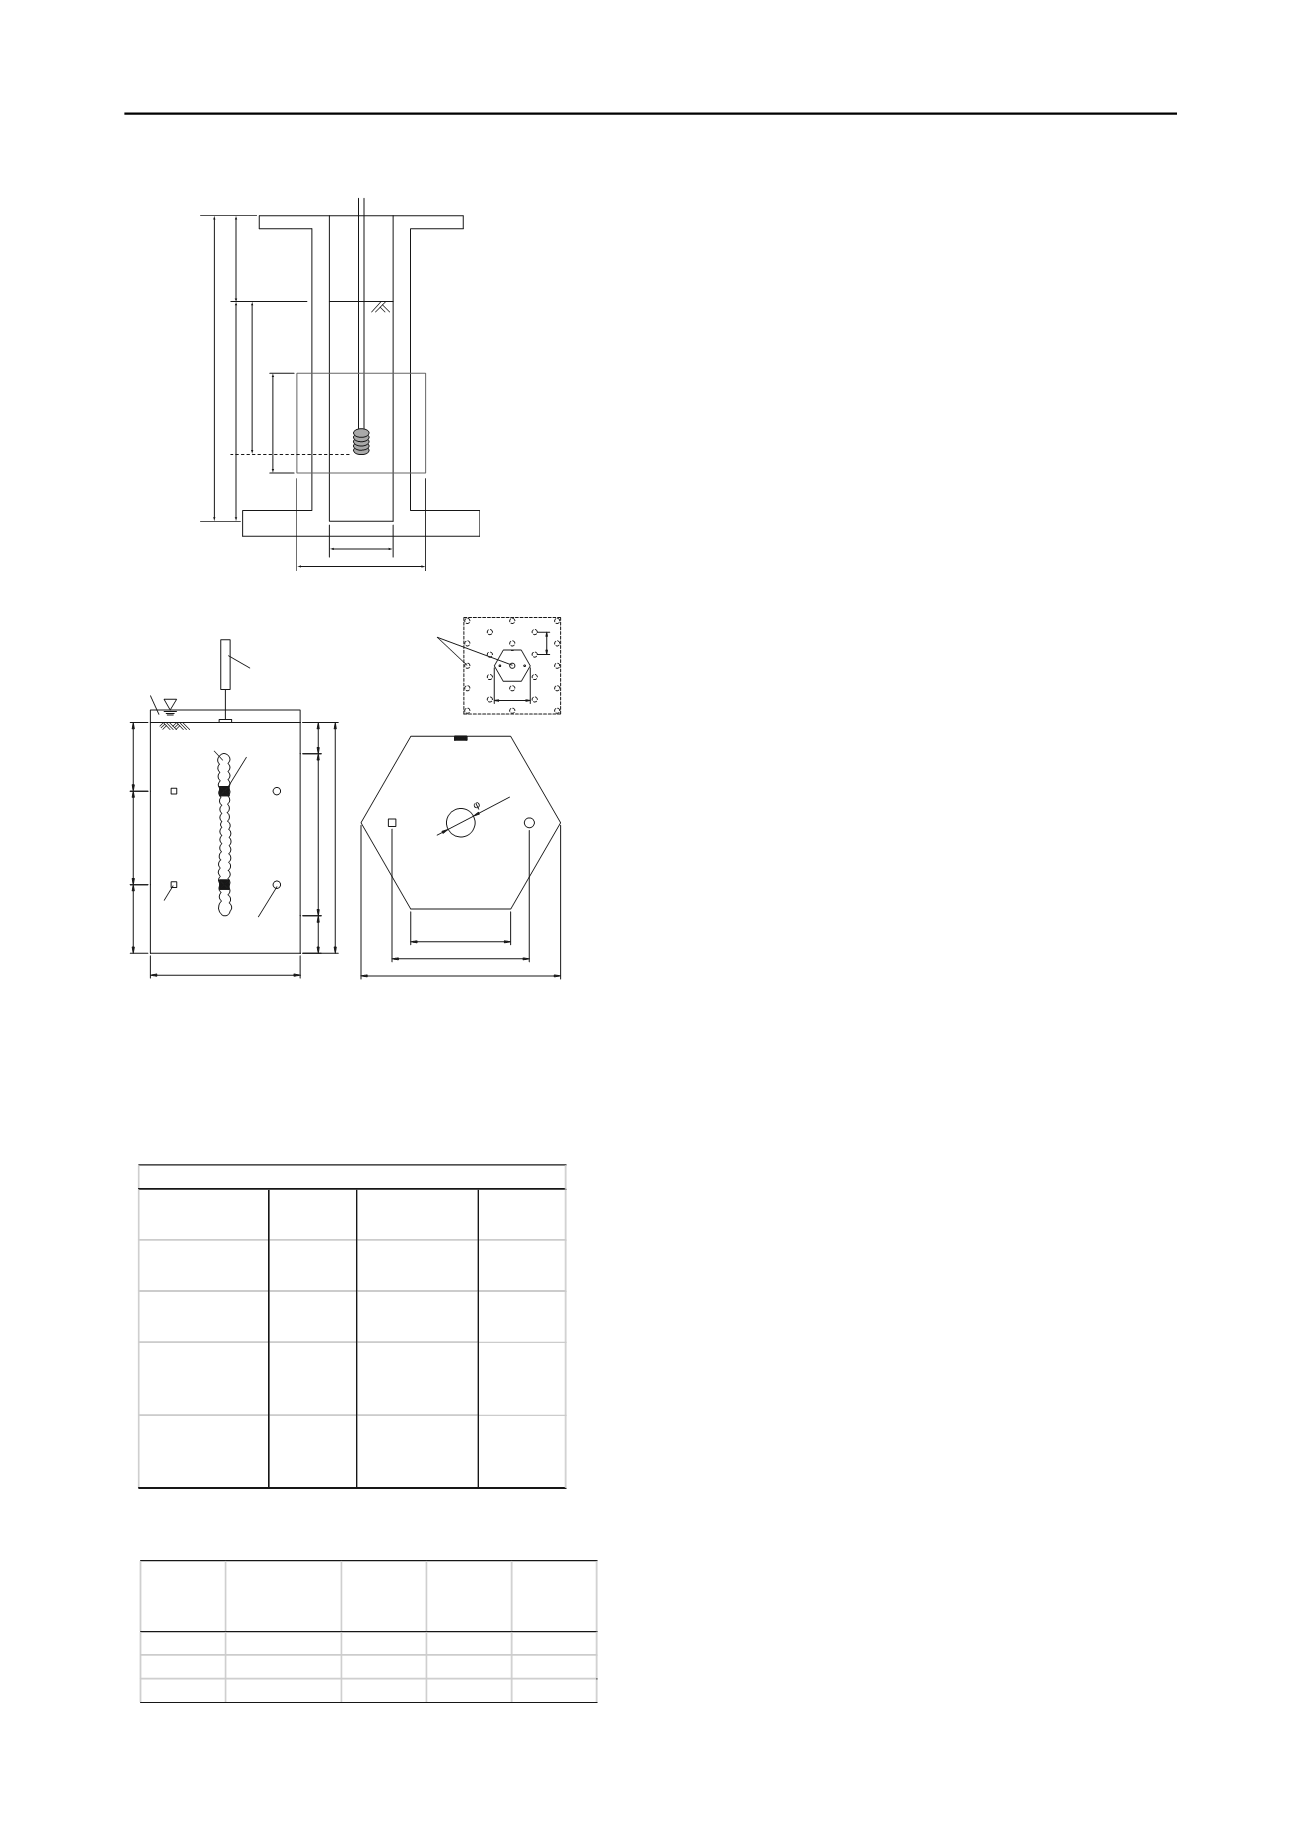
Figure 2. Schematic view of XRCT test setup
Figure 3. Schimatic view of test setup in centrifuge (CPGs30).
Table 1. properties of Soma Silica Sand #5
Table 2. List of test cases in centrifuge
prepared by air-pluviation targeting the relative density of 50 %
and Soma Silica Sand #5 is used as ground material. The
properties of Soma Silica Sand #5 are shown in Table 1. The
injected grout prepared mixing the Soma Silica Sand #5, the
Kawasaki Clay, Portland cement and water at the ration of
40 %:60 %:12 %:50 % by weight.
60
106
130
254
100
342
442
Injection rod
Scanned area
Unit:mm
As the procedure of XRCT test, the soil container was
mounted on turn table of the XRCT scanner after preparing
model ground and then grout pile was injected in a bottom-up
sequence through the injection rod. All injection and CT
scanning processes are carried out in-situ condition (in-situ
meaning x-ray scanning at the same time as injection) and full
volume of cross sectional images are recorded every two step of
grout injection. The injected volume was controlled to make the
grout pile diameter of 20 mm. The details of the injection
system can be referred in Nishimura et al. 2012. In 1g model
test using miniature model ground as XRCT test in this study, it
was concerned that the uplifting deformation caused by grout
injection will dominate because of lower effective confining
pressure therefore densification effect will not be evaluated
correctly. In order to avoid this effect, 10 kPa of overburden
pressure was applied at tip of injection rod by filling up soil
container above the model ground by stainless cubes with 2 mm
of diameter. Reconstructed volume images were analyzed using
3D V-DIC in order to evaluate the deformation process during
grout injection.
In centrifuge tests, the model ground was prepared as same
procedure as CT test. All the test procedure, saturation of model
ground, injection of grout pile and shaking table test were
carried out under a centrifugal acceleration of 30 G. Viscous
degassed fluid (30 mm
2
/sec of dynamic viscosity) was used as
pore water. The cross section of model ground presents shearing
zone by one grout pile thus small diameter of container presents
small pile spacing or large improvement ratio. Table 2 shows a
list of test cases in centrifuge, in which case CPGd18sA and
CPG30sB models 1.8 m and 3.0 m of pile spacing (in prototype
scale) equivalent to 13.7 % and 4.9 % of improvement ratio and
case CPG30nA models ground without grout injection,
respectively. As a shaking condition, sinusoidal wave with 2 Hz
of frequency (in prototype scale) and 50 waves are applied
increasing the amplitude of vibration. During the shaking,
horizontal earth pressure, response acceleration of ground and
pore water pressure was measured.
3
RESULTS AND DISCUSSIONS
3.1 X-ray tomography
Figure 4 presents density distribution of the model ground at
each scanning steps as a result of the x-ray tomography. After
grout injection, the increase of ground density can be observed
at the side of the grout piles with increase of 25 % of relative
density thus densification effect may occur mainly at lateral side
o grout piles. The distribution of vertical and horizontal
displacement as results of DIC analysis is shown in Figure 5.
The upper line of Fig. 5 presents incremental vertical
displacement between initial-2
nd
injection (Step A), 2
nd
-4
th
injection (Step B) and 4
th
-6
th
injection (Step C) and the lower
line presents incremental horizontal displacement, respectively.
Horizontal displacement is localized in the area around the
grout pile through all the steps. On the other hand, vertical
displacement beneath the grout pile can be observed at Step A
injecting deeper position and the downward displacement is
decrease with injecting position shallower. These features
indicate that the mechanism of ground deformation caused by
grout injection can be considered as a cavity expansion for deep
injection and cone uplift for shallow injection. The map of
maximum shear strain and volumetric strain calculated from
DIC results are shown in Figure 6. The general tendency
observed from Fig. 6 is that shear strain is localized around the
model ground
horizontal crossection
LVDT
model ground
vertical cross-section
grout pile
DT1
A11
A12
P1
P2
E1
E2
puressure cell
pore water
pressure cell
acceleration
gage
0.69 (23)
3.5 (116)
11.1 (370)
7.8 (260)
1.8 (60)
3.3 110)
(
4.5 (150)
3.3 (110)
3.5 (116)
1.7 (58)
2.4 (80)
digassed water
3.0
(100)
grout pile
3.5 (116)
plane viwe of a improved site
1.5(50)
units:[
m] in prototype scale ([mm] in model scale
)
Specific gravity,
G
s
2.65
Median particle
size, D
50
0.35 mm
Maxumum void
ratio, e
max
1.115
Coefficient of
uniformity, Uc
1.5
Minumum void
ratio, e
min
0.71
Shear resistance
angle, φ' (from
Dr=50 %)
36.1°
Shear resistance
angle, φ' (from
Dr=90 %)
40.4°
Soma Silica Sand #5
Case
Improvement
ratio (%)
Pile
spacing
(m)
Pile
diameter
(m)
Relative
density
(%)
CPGd18s
13.7
1.8
0.7
55
CPGd30n
-
-
-
41.3
CPGd30s
4.9
3
0.7
70.4


