959
Technical Committee 104 /
Comité technique 104
delivered to the centrifuge. Any changes were made by hand
during the centrifuge flight. The on board instrumentation is
monitored to ensure that a consistent and appropriate flow was
being delivered to the pile. The position of this control tap
governed the peak flow rate and was unchanged throughout a
single installation.
3.4 Maintaining balance
The centrifuge at Cambridge is balanced using a fixed mass
counterweight. This is cumbersome to change during a test
week and cannot be changed mid-flight. Therefore the mass of
the experimental package had to remain constant throughout the
centrifuge test, despite adding water to the package at very high
flow rates.
A passive standpipe system was designed in order to drain
excess water out of the experimental package into the centrifuge
chamber. The standpipe was positioned within the sand body
near the edge of the container – remote from any pile locations.
A set of holes at the base of the standpipe linked the water level
in the standpipe to the water table in the sand body.
Holes at the top of the standpipe allowed water to drain out
of the package through a set of drainage pipes. If the water level
exceeded the design water level at any point, water would exit
the package by draining through these top holes.
To monitor the success of the standpipe, pore pressure
transducers were used. A series of these were positioned in the
sand body to monitor the pore pressures around an advancing
pile installation. Additionally, these transducers provided
knowledge of the water table position in the model. A further
transducer was placed at the base of the standpipe to check that
the drainage system was functioning.
3.5 Testing program
All centrifuge tests to be presented in this paper were completed
at an acceleration of 60g. According to length scaling, this
modelled a 720 mm diameter, close-ended tubular pile installed
to a depth of 11.4 m. For the purpose of future discussion, all
future units will be at the model scale.
A soil stabilisation loop was completed before the first
installation in order to prevent excessive change of the sand
body between the first and subsequent flights. Following this,
multiple pile installations were completed in a single flight
using the centre's 2D actuator (Haigh et al. 2010). Piles in a
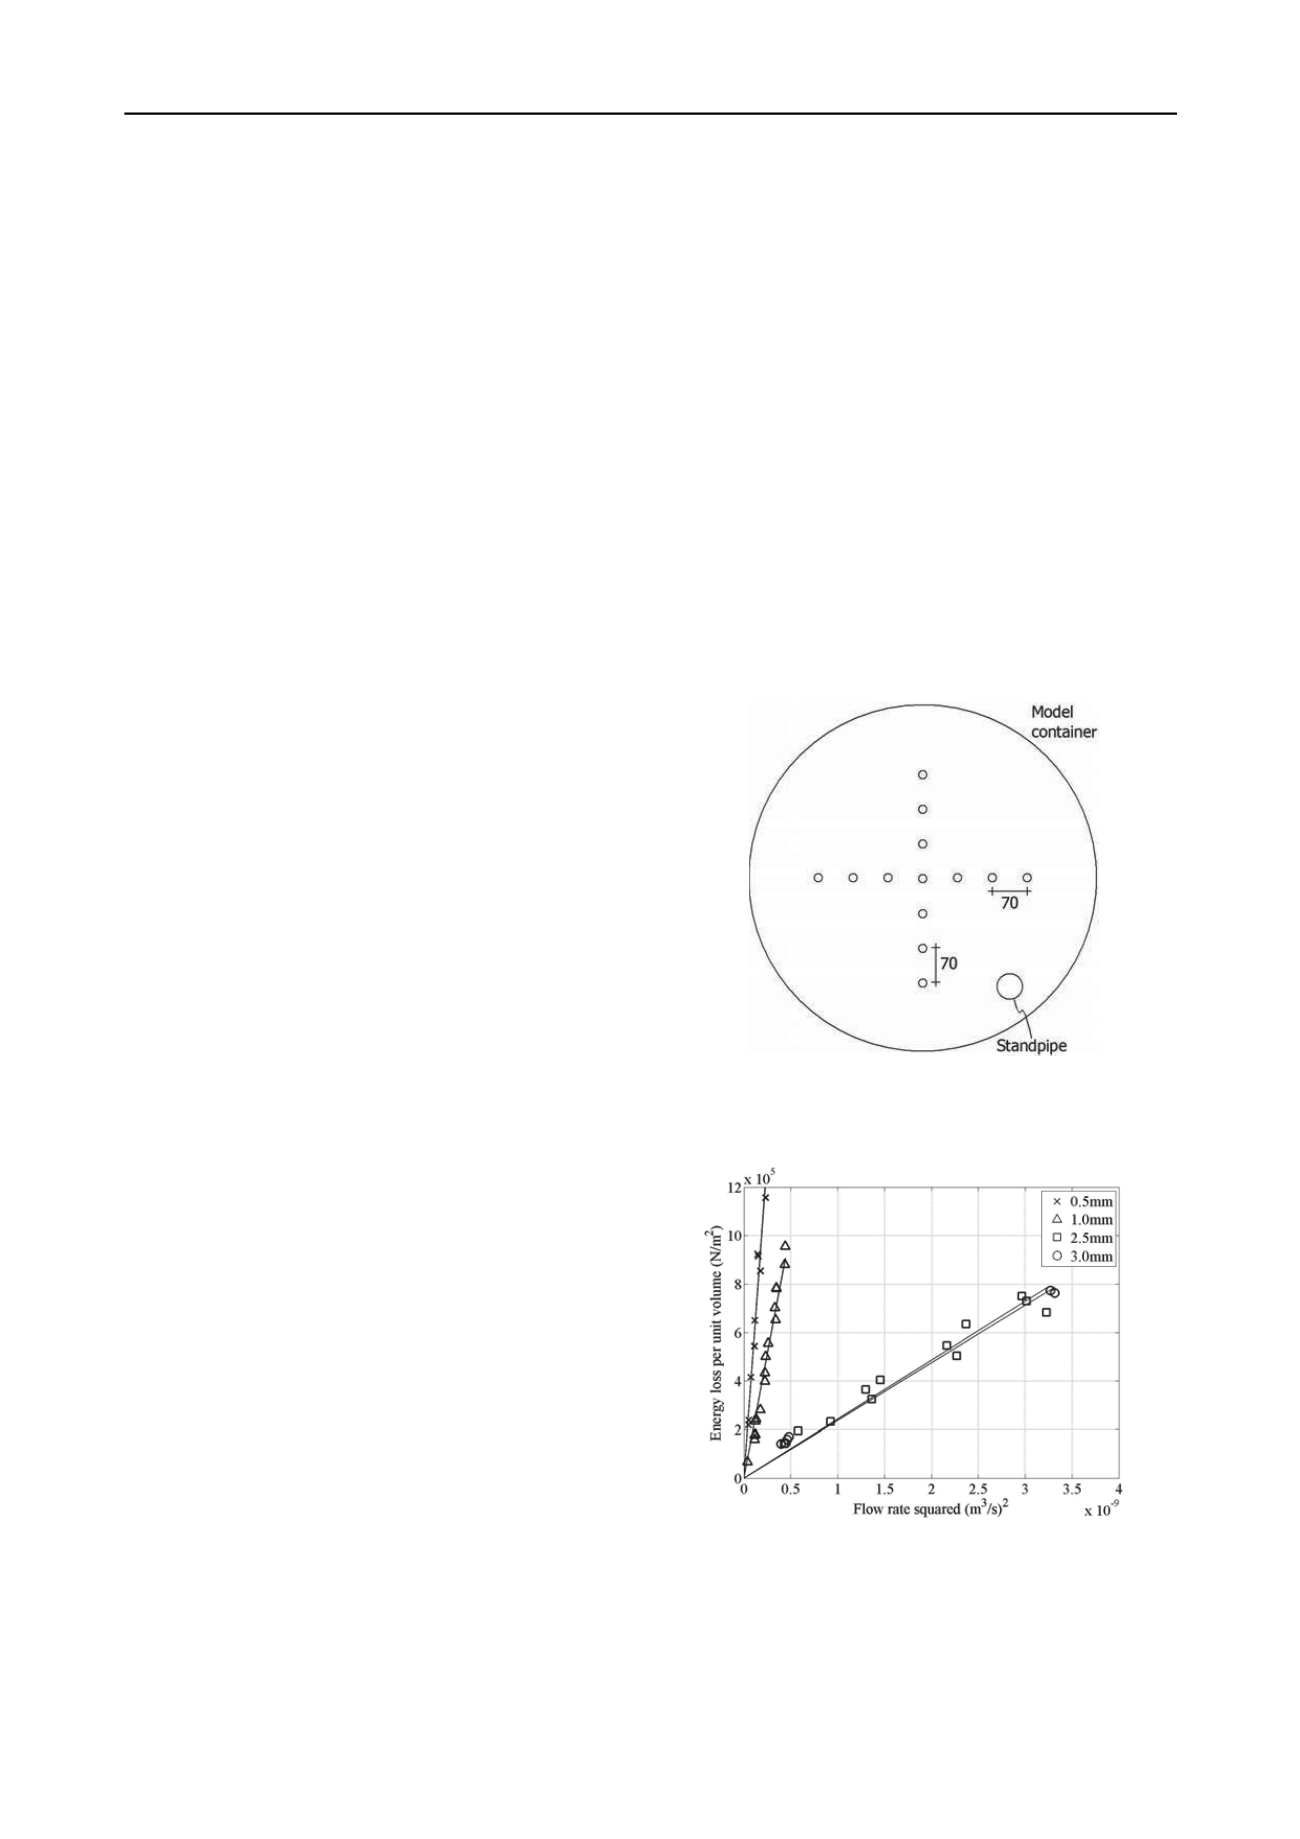
single flight were spaced at 140 mm (12D
p
), but final pile
spacing was close to 70 mm (6D
p
). A typical pile layout is
shown in Figure 3.
The nozzle at the pile toe was changed between flights to
investigate the importance of the nozzle layout. The nozzles
restricted the peak achievable flow rate, in addition to attracting
further pressure losses at the pile toe.
4 RESULTS
The discussion of results will be split into sections to discuss the
success of the water injection system and pile installation
information.
4.1 Water injection system
The novel water injection system proved to be successful. The
feeder pressure from the mains water supply provided a
relatively steady pressure of 200 kPa during testing. The flow
rate to the beam was controlled using the manual control tap; a
variety of flow rates were possible using this simple control.
Multiple flow rates were essential in order to calibrate the
loss factors in the pipe between the measurement point and the
pile toe. Increased confidence in the calculation could be
achieved if more unique flow rates were tested. Figure 4 shows
a plot of the data points used to find the loss factors for four
different nozzle sizes.
On comparing these flow test results, the effect of changing
the nozzle becomes immediately apparent. As predicted, the
smallest nozzle attracts the largest pressure losses; denoted by
the steeper gradient lines of best fit in the figure. This is a
similar result as monitoring the pressure loss from small orifice
plates blocking flow through a pipe and highlights how the loss
factors are dominated by the nozzle used.
With the larger nozzle sizes, larger flow rates were
achievable with smaller losses. There is little to no difference
between the 2.5 mm and the 3.0 mm diameter nozzles due to
their similar size to the feeder pipe. The 2.5 mm nozzle acts as
a continuation of the feeder pipe, and the 3.0mm nozzle
effectively reduces the sharpness of the pipe exit; both have
little effect on the pressure loss.
4.2 Maintaining balance
The standpipe system maintained the balance of the centrifuge.
As shown in Fig 5, the pressure of the standpipe remains
constant throughout the flight plotted. The two dotted lines for
the standpipe PPT represent brief periods where the instrument
failed during the test.
Figure 3. Typical pile layout in a single test week. At least four flights
are completed at 140 mm pile spacing in each flight.
Figure 4. Energy loss per unit volume of water passing between the
pressure line and the termination nozzle. All lines of best fit shown
have a correlation R
2
value greater than 0.94. The smallest diameter
nozzle attracted the largest loss, as expected. The 2.5 mm and 3.0 mm
nozzles attracted the same loss due to their relative size to the feeder
pipe.


