950
Proceedings of the 18
th
International Conference on Soil Mechanics and Geotechnical Engineering, Paris 2013
In the first possibility, the flow of cementitious slurry might
take place through the shear channels formed during the process
of boring. In such an event there had the possibility that the
smear zone would comprises series of lumps at random
surrounded by shear channels without altering soil properties
within the lumps. In the second possibility, flow of cement
slurry had not taken place through the smeared face of the
borehole wall uniformly and depending upon variations in
permeability cement slurry impregnated in the shape of
cylindrical veins. Less permeability might be either due to
undisturbed state of soil or due to a lesser effect of smear. As
undisturbed state of soil at the face of the borehole was not in
conformity with practical experience, then, the lesser effect of
smear would seem to govern. However, it could not be
ascertained that impregnation of cement particles took place
through the smeared face to the extent of formation of
cylindrical veins, since it was found very difficult to distinguish
between the particles of impregnated cement from that of other
similar whitish materials scattered in the soil matrix.
The findings on the smear zone and impregnation could not
therefore be properly interpreted from overall perspective due to
limitation of the study under microscope. However, the only
distinct photomicrograph showing soil-structure interface is
presented in Fig. 2 (a). From the other photomicrographs,
mapping of a distinguishable demarcation line between natural
soil and its impregnated counterpart was not found convenient
and therefore alternative technique had to be explored.
11 STAINING TECHNIQUE
Hutchison (1974) formulated a procedure to identify carbonated
ingredients in sedimentary rocks. The chemical treatment
carried out on rock sample turns the carbonated ingredient into
pink colour. Initially, this ‘staining technique’ was adopted to
identify the extent of impregnation in natural soil as
cementitious material is predominantly enriched with carbonate
particles. The staining technique was started by washing the
exposed face of the sample with 1.5% HCl solution for 10 to 15
seconds and then immersing in the reagent for 10 to 15 seconds
and drying under sun rays. The basic chemicals used for
staining tests were 1.5% HCl solution, alizerin red-s and
potassium ferocyanide. For treatment, two solutions were
prepared from the above basic chemicals, one alizerin red-s
solution (ARS) and other potassium ferocyanide solution (PFS).
Both the solutions were prepared by dissolving solvent in 100cc
of 1.5% HCl acid. For ARS, quantity of alizerin red-s was 0.2
gm while for PFS, quantity of potassium ferocyanide was 2.0
gm. The reagent was prepared by mixing ARS and PFS in ratio
3:2 for 30 to 45 seconds. This process, however, gave slight tint
of colour from which distinguishable demarcation of natural soil
with impregnated counterpart was not possible.
Eventually after many trials an appropriate staining
technique, suitable for the impregnated soil samples, was
developed modifying over the staining technique suggested by
Hutchison (1974). Prominent demarcation was noticed after the
treatments, resulting in two distinguishable colours of the
sample viz., pink and green. In order to identify material of
impregnation, hardened epoxy and cement pellet were treated
by the same technique. Hardened epoxy did not give traceable
change in colour while cement pellet turned pink. Thus cement-
impregnated portions of the samples were ascertained. The
reason behind natural soil turned green was explored and found
that alkaline material turned pink while acidic material turned
green upon reaction with the reagent. pH test conducted in
Government Agricultural Laboratory confirmed pH values of
soil ranges from 5.00 to 6.70, which confirmed acidic nature.
12 MEASUREMENT OF IMPREGNATION
To facilitate the measurement of impregnation close-up
photographs of the samples were taken with a magnification of
about two times rendering easy measurement of impregnation.
A typical photograph with a pasted scale showing dimension of
5 mm is presented in Fig 2 (b). The scale of each photograph
was derived by dividing measured length of the pasted scale in
mm by 5. Impregnation mapping of all samples were then
drawn from the photographs. A typical mapping is presented in
Fig. 3 (a).
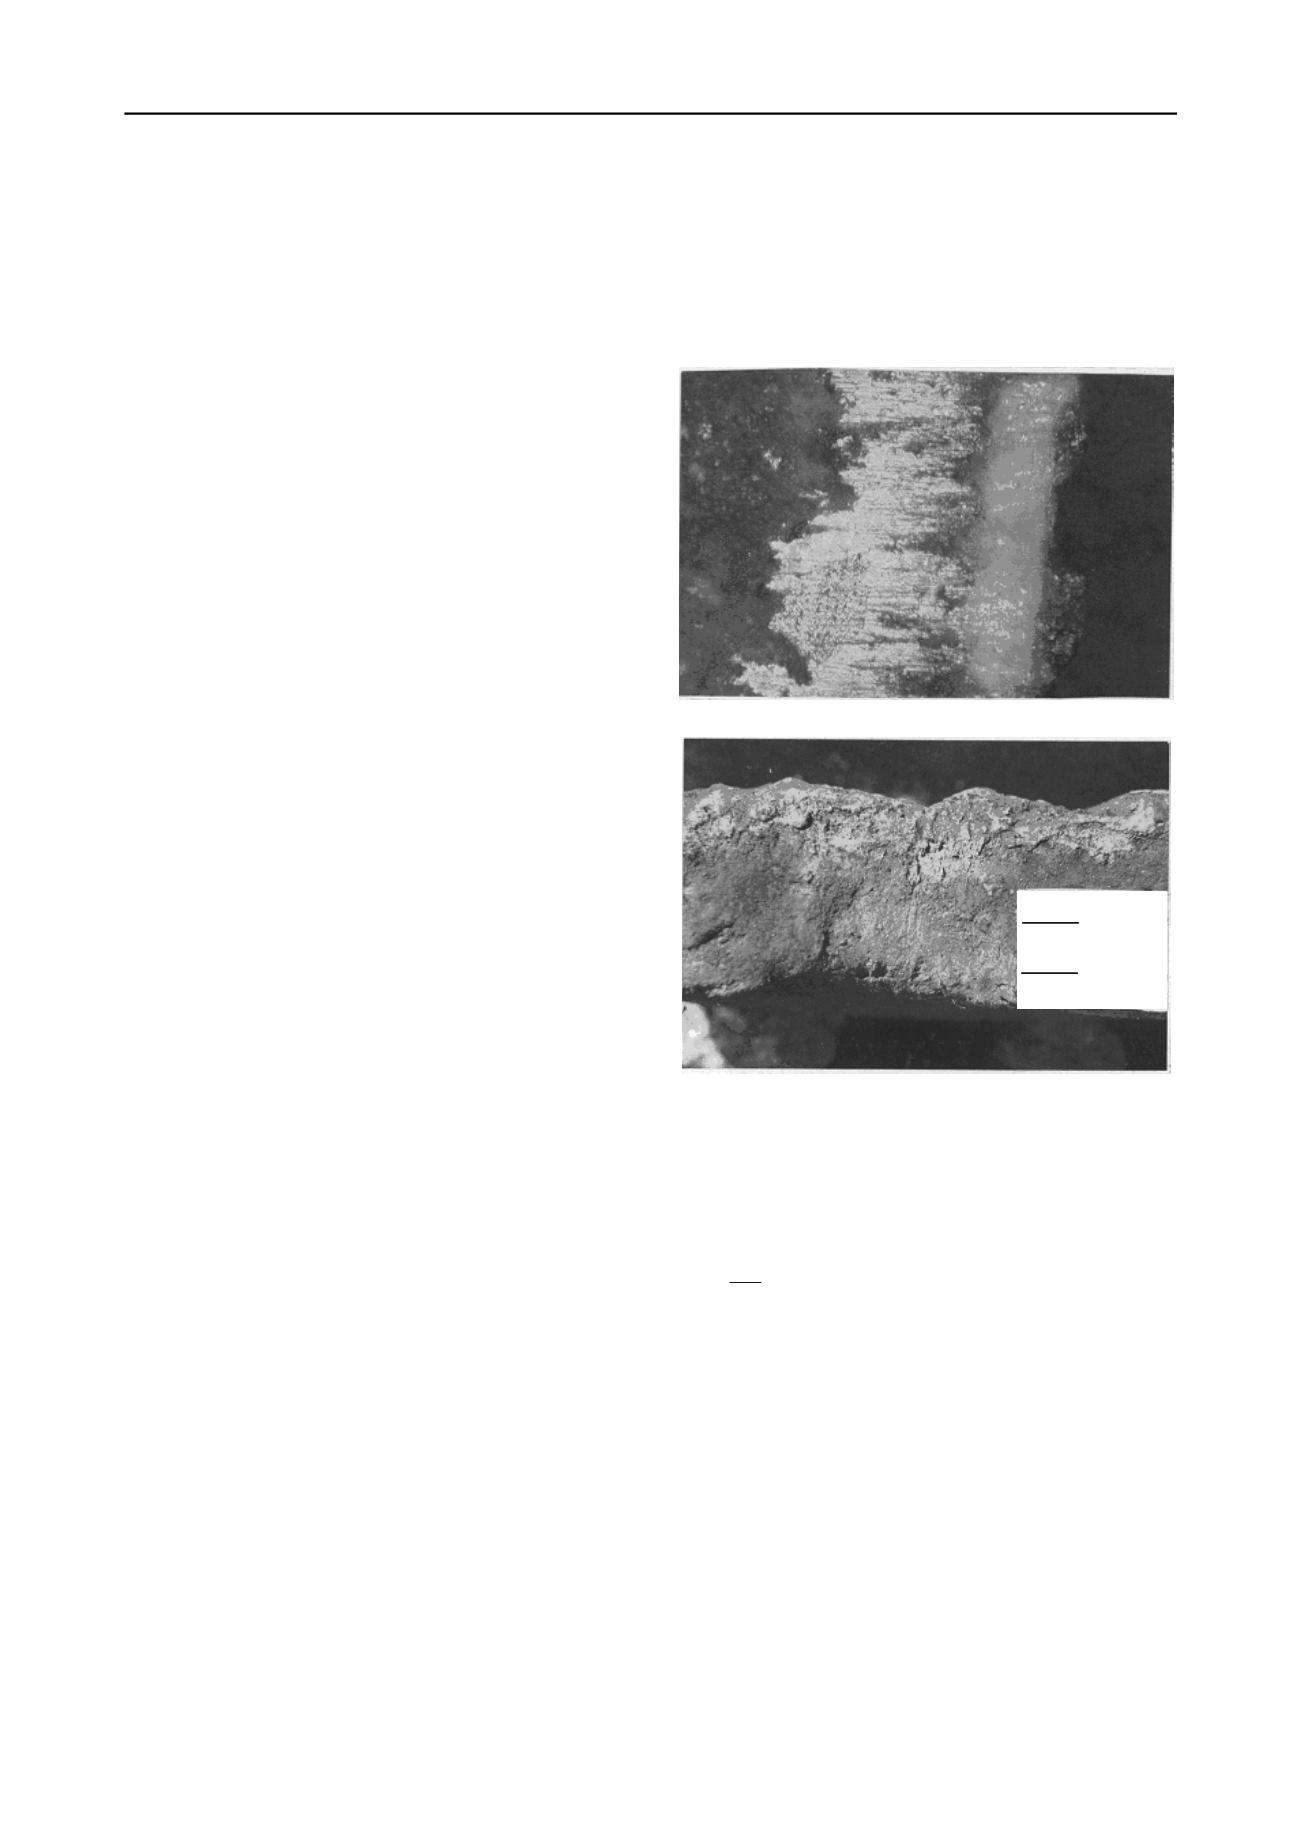
(a)
(b)
5 mm
Figure 2. (a) Photomicrograph of soil-structure interface, (b) Coloured
profile of cement impregnated soil at the soil-structure interface (After
Sarma, 2000)
The mean depth of impregnation (I
av
) was determined from the
relationship as follows:
S
L
I
iz
av
where, A
iz
is the area enveloped by impregnation zone, L
iz
length of impregnation zone, and ‘S’ the scale. Similarly, the
maximum depths of impregnation were marked and measured
multiplying by scale factor.
A
iz
(1)
13 FACTORS AFFECTING IMPREGNATION AND
FINDINGS
From the test results of samples collected from nine different
locations, the average impregnations of different types of
samples were found varying from 0.57 to 4.56 mm and
maximum impregnations were varying from 1.42 to 7.6 mm.
The peak values of average and maximum impregnation depths
corresponding to 1 kg/cm
2
slurry pressure were 2.84 mm and
6.3 mm respectively. Similarly, peak values of average and
maximum impregnation depths corresponding to 2 Kg/cm
2
slurry pressure were 4.56 mm and 7.6 mm respectively.


