940
Proceedings of the 18
th
International Conference on Soil Mechanics and Geotechnical Engineering, Paris 2013
2 EXPERIMENTAL PROGRAM
In total, 12 isotropically consolidated drained (CD) triaxial tests
were performed on consolidated kaolin specimens having a
diameter of 7.1 cm and a length of 14.2 cm. Tests were
conducted on control specimens and specimens that were
reinforced with single sand columns having diameters of 2cm,
3cm, and 4cm with a column penetration ratio H
c
/H
s
of 0.75.
The 2-cm, 3-cm, and 4cm diameter columns represent area
replacement ratios A
c
/A
s
of 7.9%, 17.8%, and 31.5%
respectively. All sand columns were placed in pre-drilled holes
in the center of the clay specimens. All specimens were
saturated using a back pressure of 310 kPa and isotropically
consolidated under effective confining pressures of 100, 150, or
200 kPa. In all tested specimens, the measured “B” value was
greater than 0.96 indicating an adequate degree of saturation.
Samples were then sheared in drained conditions at a strain rate
of 0.25% per hour (~0.06mm/min). All tests were terminated at
a maximum axial strain of about 12%.
2.1. Material Properties
The clay used in the testing program is a kaolin clay with a
liquid limit of 55.7%, a plasticity index of 22.4%, and a specific
gravity of 2.53. Consolidation and strength properties for the
clay are presented in Najjar et al. (2010). Ottawa sand which
classifies as poorly graded sand (SP) according to the Unified
Soil Classification System was used to construct the sand
columns. For sand specimens prepared at a dry density of 16.2
kN/m
3
(relative density of 44%), Najjar et al. (2010) reported an
effective peak friction angle of 33
o
based on consolidated
undrained triaxial tests with pore pressure measurement. In this
study, isotropically consolidated drained triaxial tests were
conducted on sand specimens with a height of 14.2 cm and a
diameter of 7.1 cm at confining pressures of 100, 150, and 200
kPa to determine the friction angle of the sand. The resulting
effective friction angle was found to be equal to 35
o
. The
difference between the measured effective friction angles from
the CU+U and CD tests could be attributed to the respective
mean effective stresses at failure which were an order of
magnitude greater for the undrained tests.
2.2. Sample Preparation
Kaolin clay powder was mixed with water at a water content of
100% (i.e. 1.8 times its liquid limit) to form a slurry. The slurry
was then poured into custom-fabricated consolidometers in
preparation for one-dimensional consolidation. Dead weights
were used to consolidate the specimens from slurry to a vertical
effective stress of 100 kPa. The water content at the end of the
consolidation stage was relatively uniform (~53%) throughout
the depth of the sample. The average bulk density for all the
clay specimens prepared was about 16 kN/m
3
. A detailed
description of the sample preparation and testing procedure is
presented in Najjar et al. (2010).
The sand columns were formed from Ottawa sand at a dry
density of about 16.2 kN/m
3
. These sand columns were
prepared by pouring 3 layers of dry Ottawa sand in cylindrical
pre-cut and stitched geosynthetic fabrics. The fabrics were
initially inserted in a glass tube having the same inner diameter
as the sand column, and the sand layers were densified by
vibration. Water was then added to the sand column to reach a
water content of about 20%. The saturated sand column was
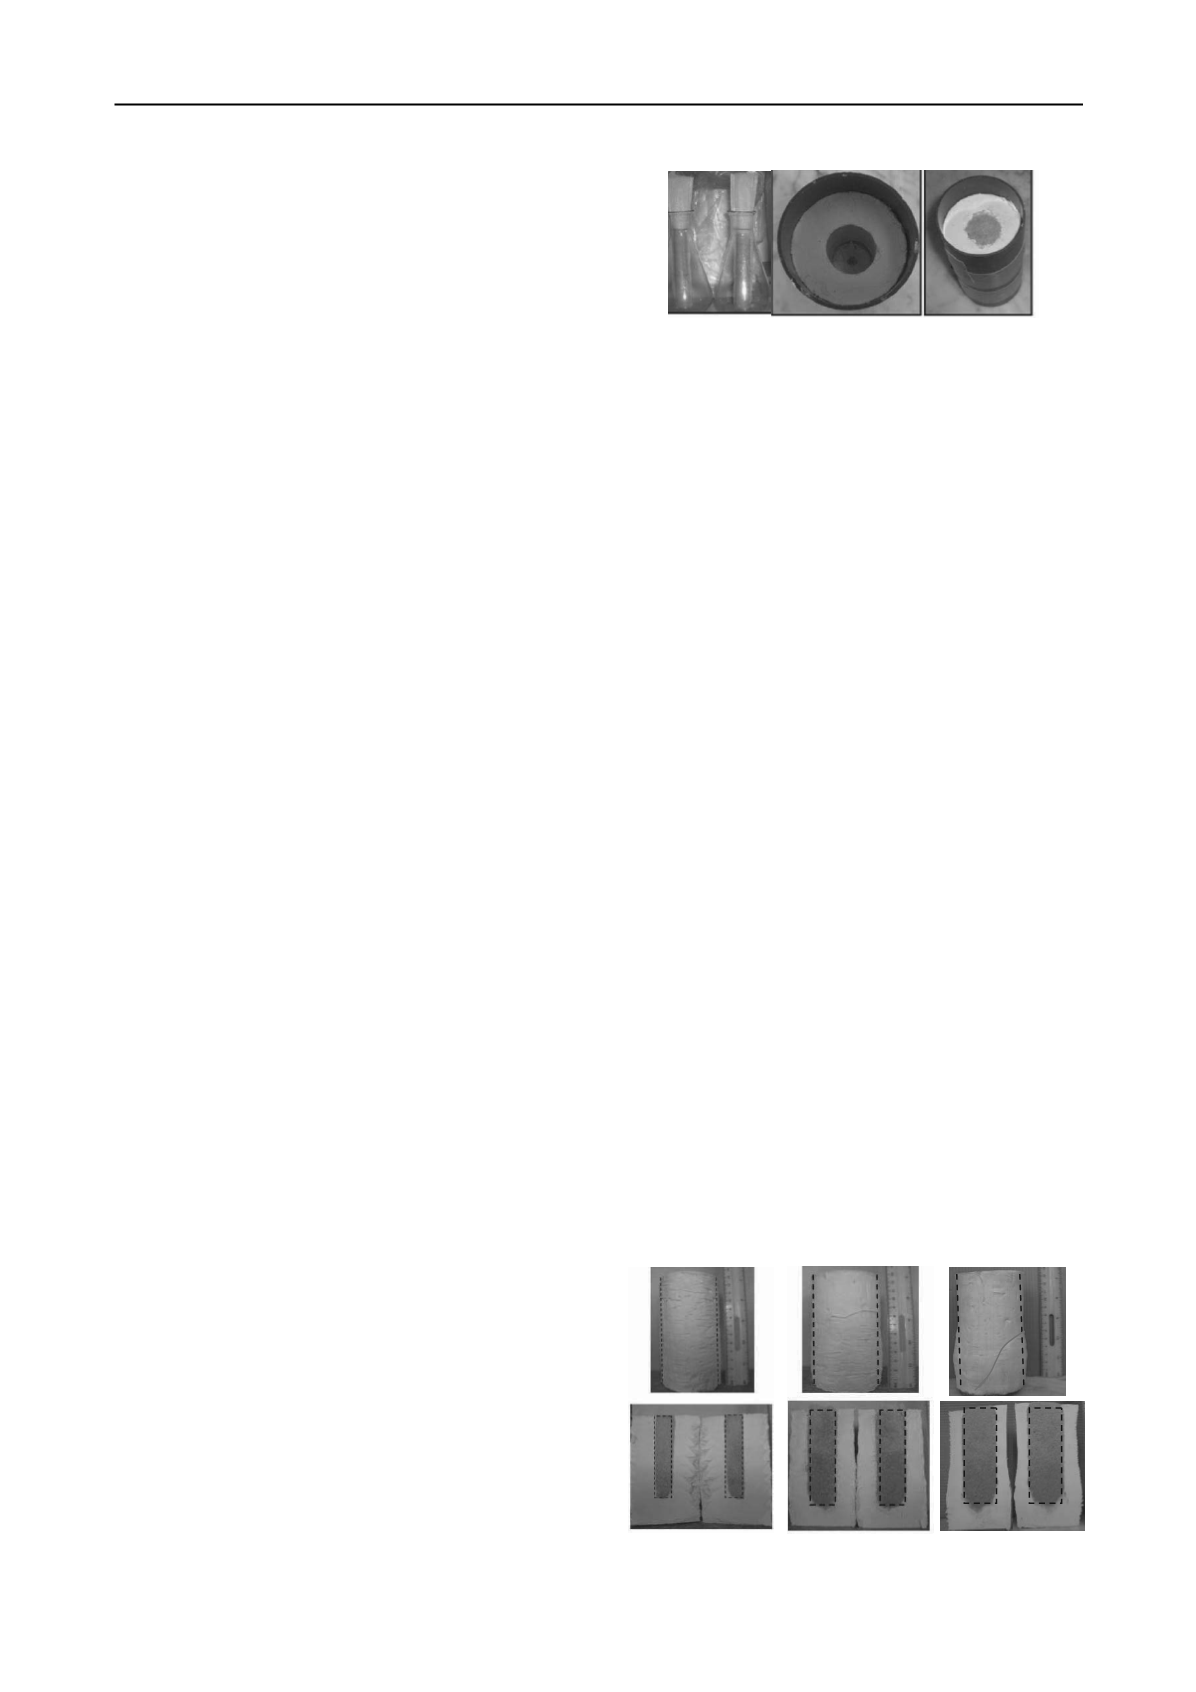
then frozen for 24 hours (Fig. 1a). The geosynthetic fabric was
cut and detached from the sand column. The frozen sand
column was then inserted into a hole drilled at the center of the
clay specimen (Fig. 1b) and allowed to thaw. The reinforced
clay specimen (Fig. 1c) was then transferred to the triaxial cell
and saturated using a back pressure of 310 kPa.
Figure 1. Installation process of sand columns.
3 TEST RESULTS AND ANALYSIS
The automated triaxial test setup “TruePath” by Geotac was
used to conduct CD tests on control and reinforced clay
specimens saturated at a back pressure of 310 kPa. The samples
were then isotropically consolidated under confining pressures
of 100, 150, or 200 kPa and sheared drained at a strain rate of
0.25% per hour, while measuring volume change through drain
lines connected to the porous stones at the top and bottom of the
sample. The measured volume change reflects a global change
in the composite sample and do not provide information on
local changes in the water content in the sand column and the
surrounding clay. Throughout the tests, the total confining
pressure was kept constant as the vertical stress was increased in
compression.
3.1. Mode of Failure
The mode of failure was characterized by bulging of the clay
specimen. The bulging was slight and relatively uniform along
the height in samples reinforced with the smallest area
replacement ratio of 7.9% (see Fig. 2a). As the area replacement
ratio increased, the bulging was significant and concentrated in
the lower half of the clay specimen, indicating stress and strain
concentration in the unreinforced portion of the specimen. For
the largest area replacement ratio of 31.2%, clearly defined
shear planes formed in the lower half of the sample as indicated
in Fig. 2c.
To investigate the mode of failure of the sand columns, the
same test specimens were split along their vertical axes to
expose the columns and the surrounding clay (Figs. 2a-2c). The
figures indicate that relatively uniform bulging of the sand
columns occurred with depth, with the specimens at the higher
area replacement ratios showing signs of punching of the sand
columns into the unreinforced clay.
3.2. Stress-Strain Response
The variation of the deviatoric stress and volumetric strain with
axial strain is presented in Figs. 3, 4, and 5 for tests with
replacement ratios of 7.9, 17.8, and 31.2%, respectively. The
stress-strain curves exhibited consistent increases in deviatoric
stresses with strains as the samples were sheared towards
critical state conditions. In this paper, failure is defined at an
axial strain of 12%, which is the maximum strain measured.
(a) A
c
/A
s
= 7.9% (b) A
c
/A
s
= 17.8% (c) A
c
/A
s
= 31.2%
Figure 2. Internal and external modes of failure.


