937
Technical Committee 104 /
Comité technique 104
Figure 2. Impedance test using a hammer impact on the foundation.
So, the equation of motion of the system can be written as:
−
+
+
= ()
(1)
, where
and
denote to the real and imaginary part of the
vertical soil stiffness, and
is the mass of the foundation.
Figure 3. Mobility functions of the foundation.
At low dimensionless frequencies
= /
< 0.25, the soil
stiffness
is approximately equal to the static vertical
impedance of a rigid foundation, underlying on a homogeneous
half space, (Sieffert and Cevaer 1992):
= 4
/(1 − )
(2)
, where
is the shear modulus of the soil and
is the
foundation ratio.
Using a curve-fitting technique based on the least-square
method, each parameters of the equation of motion (1) can be
identified. Therefore, the shear modulus of the upper layer of
the sand can be determined. For
= 5 cm,
ν
= 0.33, the shear
modulus in the center area of the container is almost uniformly
distributed with an average value of 12.5 MPa. Near the
sidewalls, however, the non-uniform distribution is observed.
The sand properties (the density and the shear modulus)
measured by the density test and the impedance test will be used
in the numerical modeling.
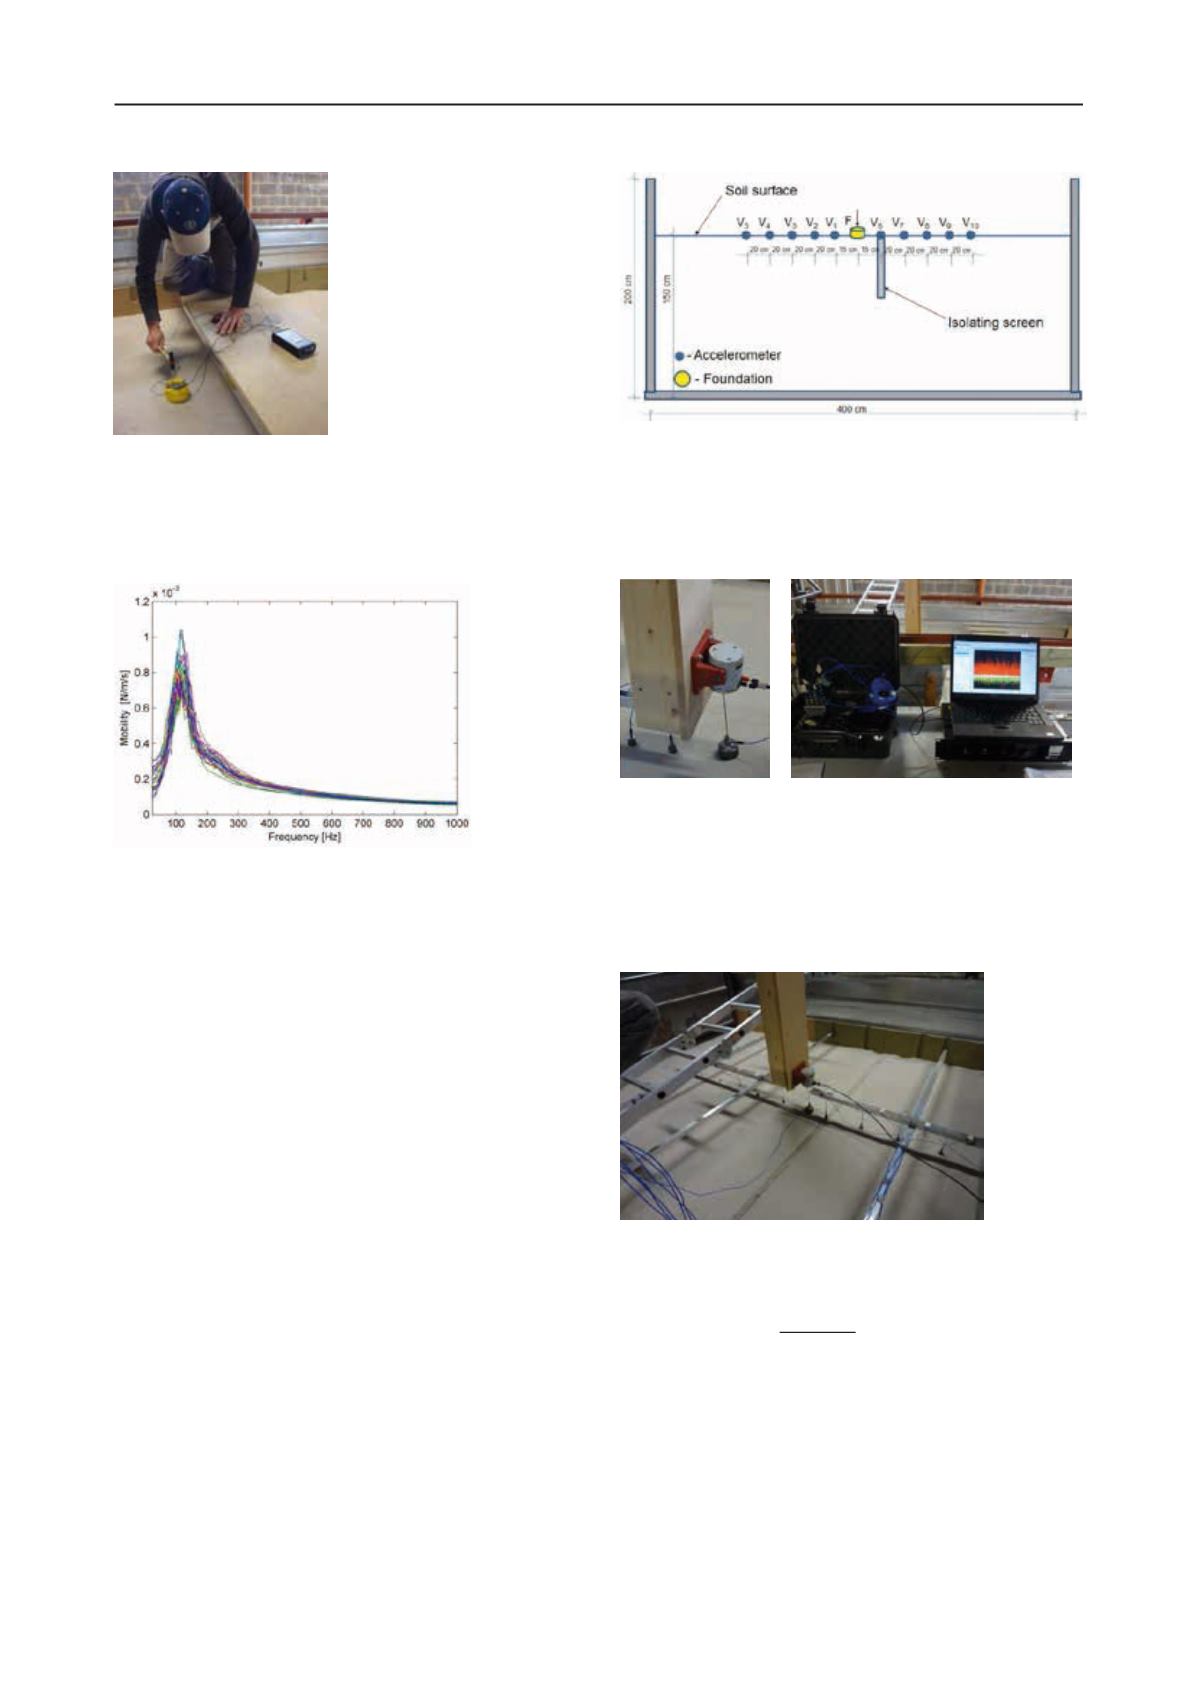
3 MEASUREMENT SETUP
The isolating screen is installed at the middle of the container.
The screen is a concrete plate of 2.0 m x 0.4 m x 0.04 m. The
measurement configuration consists of a small foundation posed
on the soil surface where the dynamic force is applied and 10
accelerometers placed at the measurement points. The small
foundation is excited at the frequency band of interest and the
free field vibrations are measured symmetrically on both sides
of the foundation, figure 4. This configuration enables us to
simultaneously measure the non-isolated responses (on the side
without the screen) and the isolated responses (on the side
where the screen is installed).
Figure 4. Overview of the measurement setup (the section view).
A shaker device is used for the excitation generation. The type,
the amplitude and the frequency content of the excitation can be
controlled by means of a wave generator software that feeds
into a power amplifier, figure 5.
Figure 5. Shaker device and acquisition system.
A random vibration from 100 to 900 Hz is used. To obtain a
reasonable coherency, the excitations were applied for a period
of at least 3 minutes. Based on four frequency ranges, four
separate measurements were performed.
Figure 6 shows the configuration of the measurements for the
concrete barrier test. The efficiency of the isolating barrier is
determined by introducing the insertion loss factor.
Figure 6. Measurement configuration for the concrete barrier test.
The insertion loss is defined using the peak particle velocity
(PPV) obtained at each measurement points.
= 20 × log
(
PPV
isolated
PPV
non-isolated
)
(9)
, where the peak particle velocity (PPV) is defined as the
maximum value of the impulse response function (IRF) at each
measurement points.
Induced vibration due to railways traffic is mostly dominated in
a frequency range from 10 to 60 Hz. According to the frequency
range of interest and the dimension of the container, a
geometrical scaling factor of 15 would be suitable.
A 2.5-dimensional coupled FE-BE method is used for modeling
of the problem. In 2.5-dimensional modeling, a longitudinally
invariant geometry of the structure (the barrier) is assumed.


