933
Technical Committee 104 /
Comité technique 104
- a Fast Ground Based Synthetic Aperture Radar system,
measuring a two-dimensional displacement field of the slope at
the side of the failure every five seconds;
- a total of four tubes measuring temperature and strain
profiles over depth employing glass fibre optics: two vertical
tubes 5.5m long halfway the slope at the side of the failure, one
vertical tube 3.5m long at the toe at the same side in the centre
line and one horizontal tube along the whole toe of the dike;
- a thermic infrared camera facing the downstream slope,
with a resolution of 640x480 pixels and an accuracy of 0.05 K;
- one controllable drainage tubes with measurements of pore
pressure, temperature and discharge, located inside the sand
core, close to the toe at the side of the failure;
- eight instruments measuring pore pressure, temperature and
local inclination distributed over two cross-sections 10m away
from the centre line, in each cross-section one instrument in the
sand core close to the toe and three instruments distributed over
depth in the soft soil deposits under the toe.
4 RESULTS OF THE EXPERIMENTS
4.1
West dike
The test on the West dike started on August 21
st
at 4:30 pm.
Filling the reservoir about 1m already caused serious cracks in
the upper part of the dike. Also, leakage through the small clay
dike occurred. Compaction of this clay was not sufficient. Once
the situation stabilized, the upstream level was increased again.
At a head drop of 1.56m the first wells appeared and sand
producing wells (piping) appeared at a head drop of 1.79m.
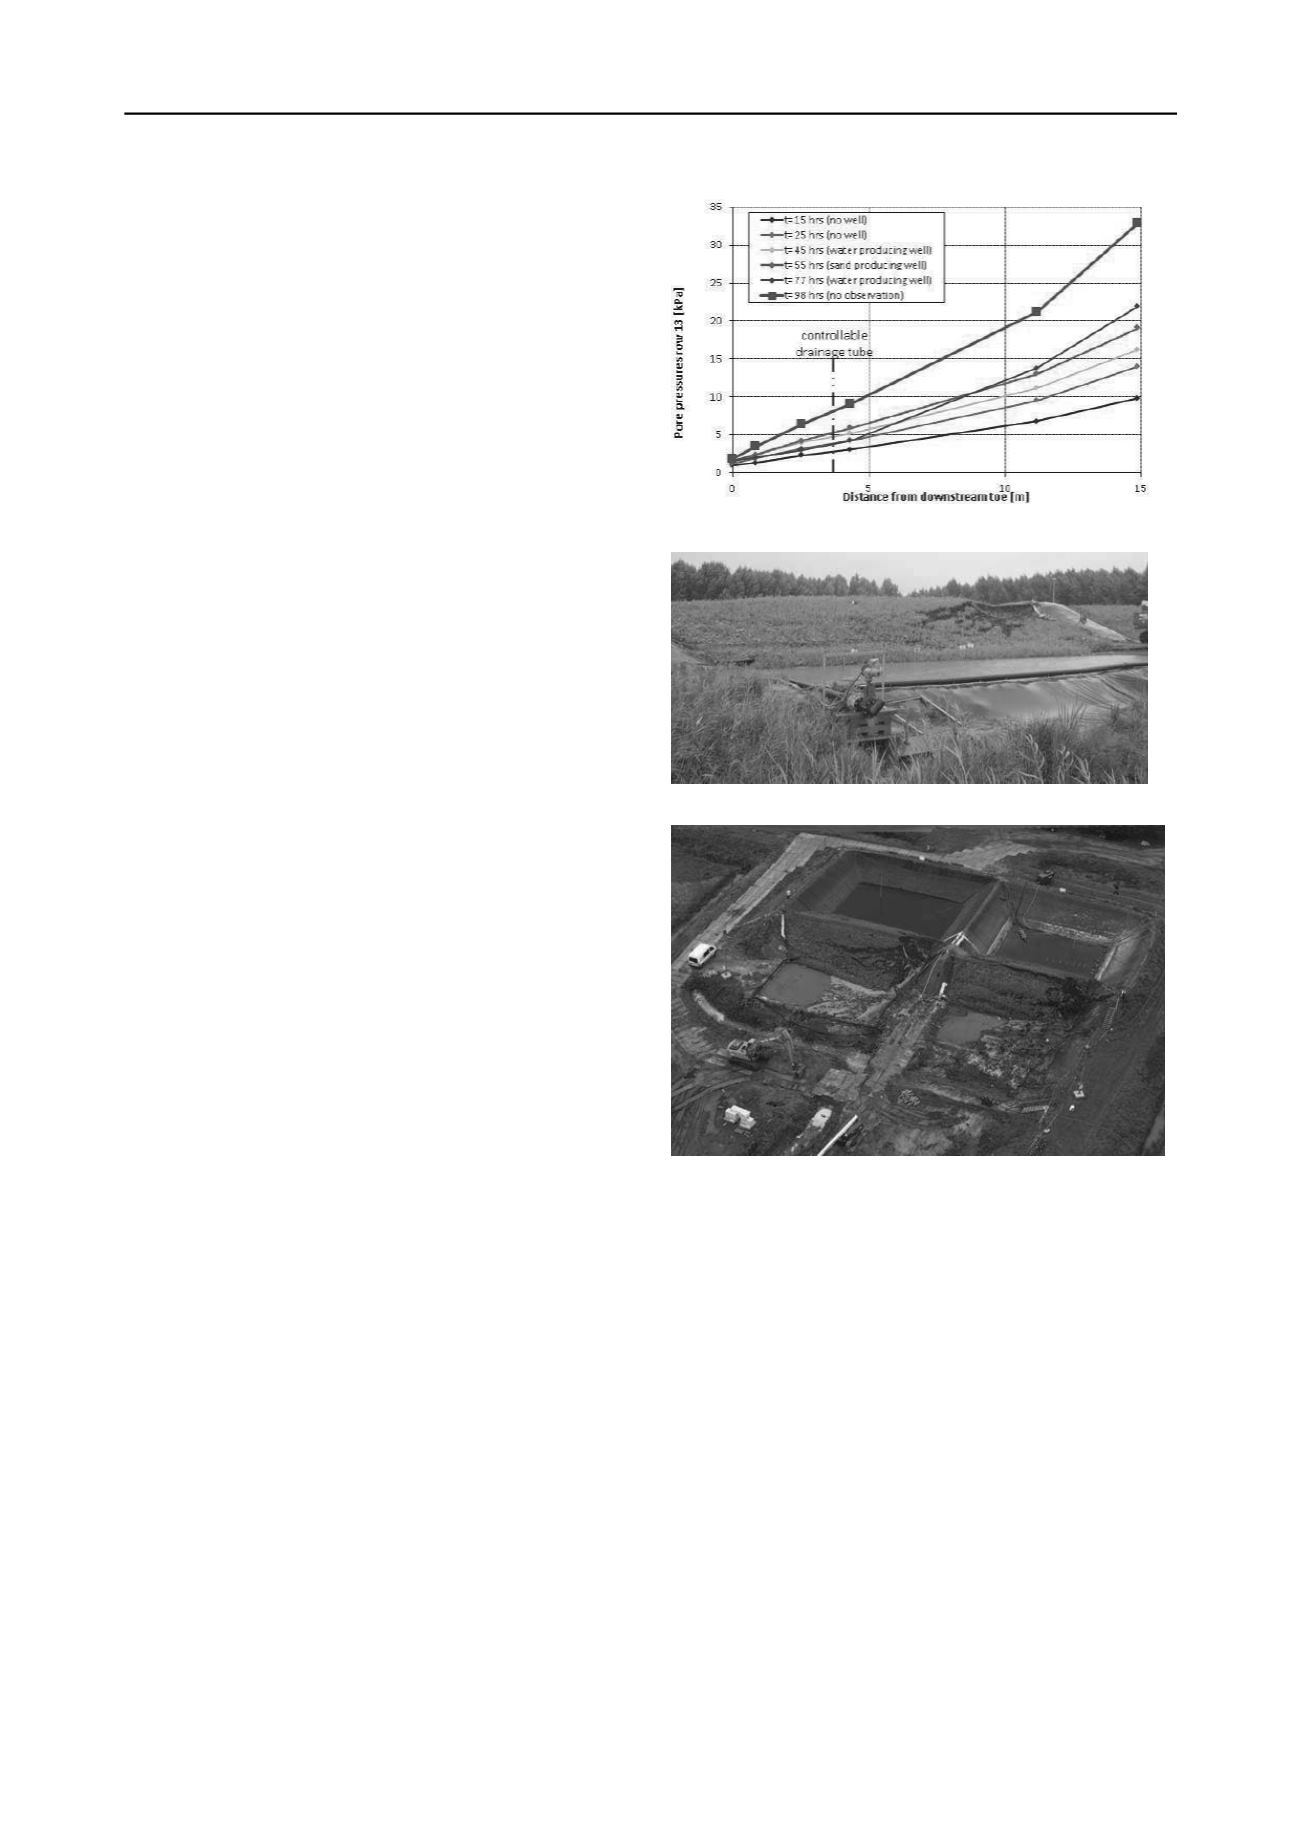
At 66.7 hours after the start of the test (t=66.7hrs), at a head
drop of 2.02m, the lower drainage tube was partly opened as
piping had already been detected at the third line of pore
pressure meters, i.e. upstream of this tube. This had a clear
effect on the pore pressures, as shown in Figure 3, and the
piping process stopped.
Meanwhile, the sand core became saturated, as measured by
the upper pore pressure meters. At t=63.6 hrs, the upper
drainage tube was opened and the pore pressures in the core
were controlled. At t=94.0 hrs, both tubes were closed and the
pore pressures rised sharply. From t=97.6 hrs, sliding of the
downstream slope started to occur.
At t=110.1 hrs, considerable sliding of the downstream slope
had occurred. Piping had resumed too, but the continued sliding
from micro-instability of the sand core caused so much
settlement of the crest that at t=111.9 hrs (August 26
th
at 8:24
am) failure occurred.
4.2
East dike
The test on the East dike started on August 21
st
at 3:20 pm and
ran parallel to the test on the West dike. In many ways, both
tests were similar, although the controllable drainage tubes were
missing at the East dike. Wells occurred at the downstream
slope at a head drop of 1.60m and piping started at a head drop
of 2.02m. However, piping was detected only in the two lines of
pore pressure meters downstream of the coarse sand filter,
upstream no piping could be traced. Apparently, this measure
worked.
As the last stages of the hydraulic load were delayed in
comparison with the West dike, severe settlements from micro-
instability of the sand core occurred later. Here at t=138.9 hrs
(August 27
th
at 10:18 am) failure from micro-instability
occurred. Figure 5 shows an overview of both failures.
4.3
South dike
The test on the South dike started on September 3
rd
at 12:12 pm,
Figure 3. Pore pressures at sand/clay interface West
Figure 4. West dike close before failure.
Figure 5. West and East dikes after failure.
by infiltration of water into the sand core. The next day, a small
excavation was made in front of the dike. This had a limited
effect on the dike, as shown in Figure 6 by the horizontal
displacements at the toe of the dike. The next day, a final
excavation was made and on the basis of slope stability
calculations it was decided to continue by hydraulic loading
only. In order to acquire a lot of measurement data, several days
were taken to raise the phreatic surface in the sand core and to
fill the water tanks on top. Finally, failure occurred on
September 8
th
, at 2:27 pm, after 122.26 hours, see Figure 7.
Table 1 shows the results of slope stability calculations at
characteristic moments applying the models of Bishop (1955)
and Van (2001). The latter is a geometrically more flexible
variant to Bishop’s model. The results correspond well to the
deformation behaviour shown in Figure 6: close to the critical
value of 1, the deformations quickly increase. These results may
even draw some suspicion, but it should be borne in mind that
quite advanced soil investigations had been carried out prior to
the test (Zwanenburg et al. 2011, Koelewijn and Bennett 2012)
and detailed actual measurements of pore pressures were
available. Moreover, the model by Bishop has already long ago
been described as surprisingly accurate for conditions close to
failure (Spencer 1967).
Table 2 gives the measured values of the horizontal
deformations during the last phase of the test for all


