924
Proceedings of the 18
th
International Conference on Soil Mechanics and Geotechnical Engineering, Paris 2013
was set to be 90%. After construction of the embankment, laser
displacement sensors were installed at the prescribed locations.
In addition, the targets were inserted in each compacted layer,
for quantifying the displacements between before and after the
tests by PTV (Particle Tracking Velocimetry) technique. The
centrifugal gravity used in this study was 50G.
The infiltration of water has been performed from the three
slits of the right side wall (see Figure 1). The water of 2,000mL
was prepared in the water supply tank attached on the model
container. The water level of the tank was set to be 6.75m. The
valves of the three slits installed on the wall with the height of
1.5m, 3m, and 4.5m from the bottom were opened and the water
flowed into the model embankment and the base ground
through the slits. In the present study, the water was used as the
pore fluid, whereas viscous fluids with the 50 times viscosity of
water, e.g., metolose solution, are often used for satisfying the
similarity rule. This is because the matric suction of the
metolose solution is smaller than that of the water. Note that the
permeability of the embankment is 50 times in 50G field.
The centrifuge was spun up to an acceleration of 50G and
seepage in 50G field was started. The water level was increased
and reached close to the steady state, dynamic loads was applied
to the model embankment. The tapered sine waves with a
frequency of 1 Hz and an amplitude of approximately 400 gal
were used as an input wave, and the duration of the wave was
30 seconds.
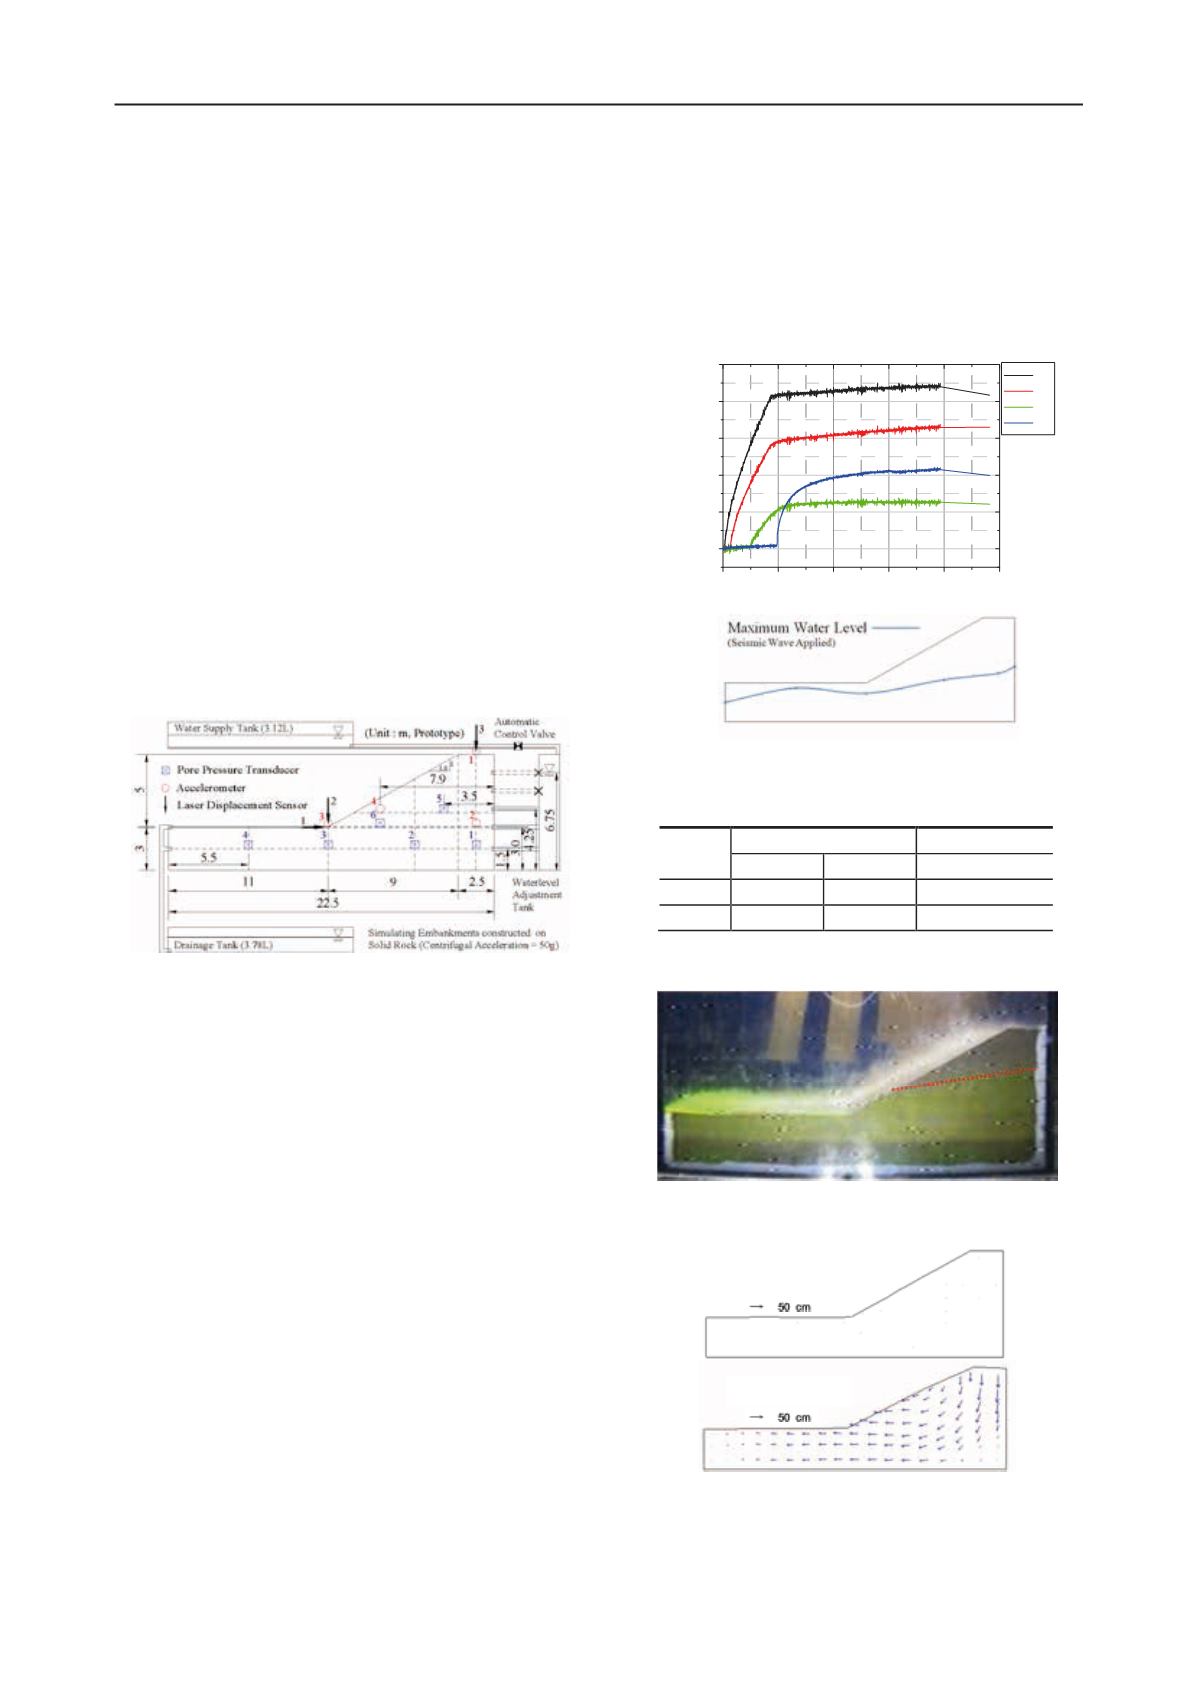
Figure 1. Model embankment and arrangement of sensors
2.3
Testing program
Two dynamic centrifugal model tests were performed. One has
been conducted without infiltration (Case 1), and the other has
been done with the seepage flow (Case 2). Average water
content measured after the test was 12.7% in Case 1, which is
similar to the optimum water content.
2.4
Test results
Figure 2 demonstrates a time profile of the pore water pressure
at the base ground during the infiltration process and the water
level estimated by the pore water pressure. All of the
experimental results are expressed in a prototype scale
hereinafter. It is seen that the pore water pressures were
increased induced by the infiltration of water and reached
almost steady state after 12 hour. The seepage area is shown in
Figure 3 obtained in the other test with the same testing
conditions as Case 1 other than the use of the yellow colored
water. It is seen that the seepage area is wider than that
estimated by the pore water pressures as shown in Figure 2.
This indicates that the unsaturated seepage flow occurs in the
specimen.
Figure 4 shows the distribution of displacement vector, and
Table 2 shows the displacements at the toe of the slope and the
crest. Displacement in Case 2 is much larger than Case 1 due to
the effect of infiltration. This suggests that an increase of the
pore water pressure by infiltration causes the decrease in suction
and the skeleton stress of the embankment.
Time profiles of the excess pore water pressure measured
under the crest (No.1) and in the base ground (No. 4) are shown
in Figure 5. Note that the pore water pressure at the beginning
of the loading is shifted to zero. While the excess pore water
pressure levels in Case 1 are almost zero, those in Case 2 are
rather high. In particular, it is possible that liquefaction occurs
because the pore pressure of P4 at the base ground of Case 1
increases up to the initial vertical stress.
Figure 3. Seepage area indicated by yellow colored water
Figure 4. Distribution of the displacement vectors
Table 2. Displacements after the tests
Case
Toe of the Slope
Crest
x
y
y
1
-0.4
7.1
0.2
2
-213.0
24.0
-380.0
* x: horizontal displacement, y: vertical displacement (in
prototype, unit: mm)
Figure 2 Time profile of pore water pressure and the water level
estimated by the pore water pressure (Case 2)
0
4
8
12
16
20
0
5
10
15
20
25
P3
P4
P2
P1
P2
P3
P4
Pore pressure (kPa)
Time (hour)
P1
(a) Case 1
(b) Case 2


