922
Proceedings of the 18
th
International Conference on Soil Mechanics and Geotechnical Engineering, Paris 2013
0.209
0.459
1.723
1.397
1.932
1.856
0.0
0.5
1.0
1.5
2.0
2.5
3.0
Experiment
JRA
Monotonic component of
maximum total lateral force (kN)
Crust layer
Liq. layer
Total
separately evaluated for the liquefied layer and the non-
liquefiable crust. The calculated forces are displayed in Figure
7. By comparing total lateral forces in different piles following
findings can be itemized:
- The amount of total lateral force in pile P2 (located in
.24 times that exerted
t among all
rces in pile P1 (the middle p
middle row) is less than the piles located in upslope and
downslope rows, i.e. piles P1 and P3.
- Total lateral force on pile P1 is about 1
on pile P2. This occurs due to the shadow effect. Since the
upslope pile is directly pushed by the laterally spreading soil
and acts as a barrier for pile downslope pile, P2.
- Total lateral force exerted on pile P3 is the larges
the other piles. Total lateral force on pile P3 is about 1.43
and 1.76 times those of piles P1 and P2, respectively. This
can be described by the separation of soil from the
downslope side of pile P3 during lateral spreading resulting
in lack of lateral support.
- Comparing total lateral fo
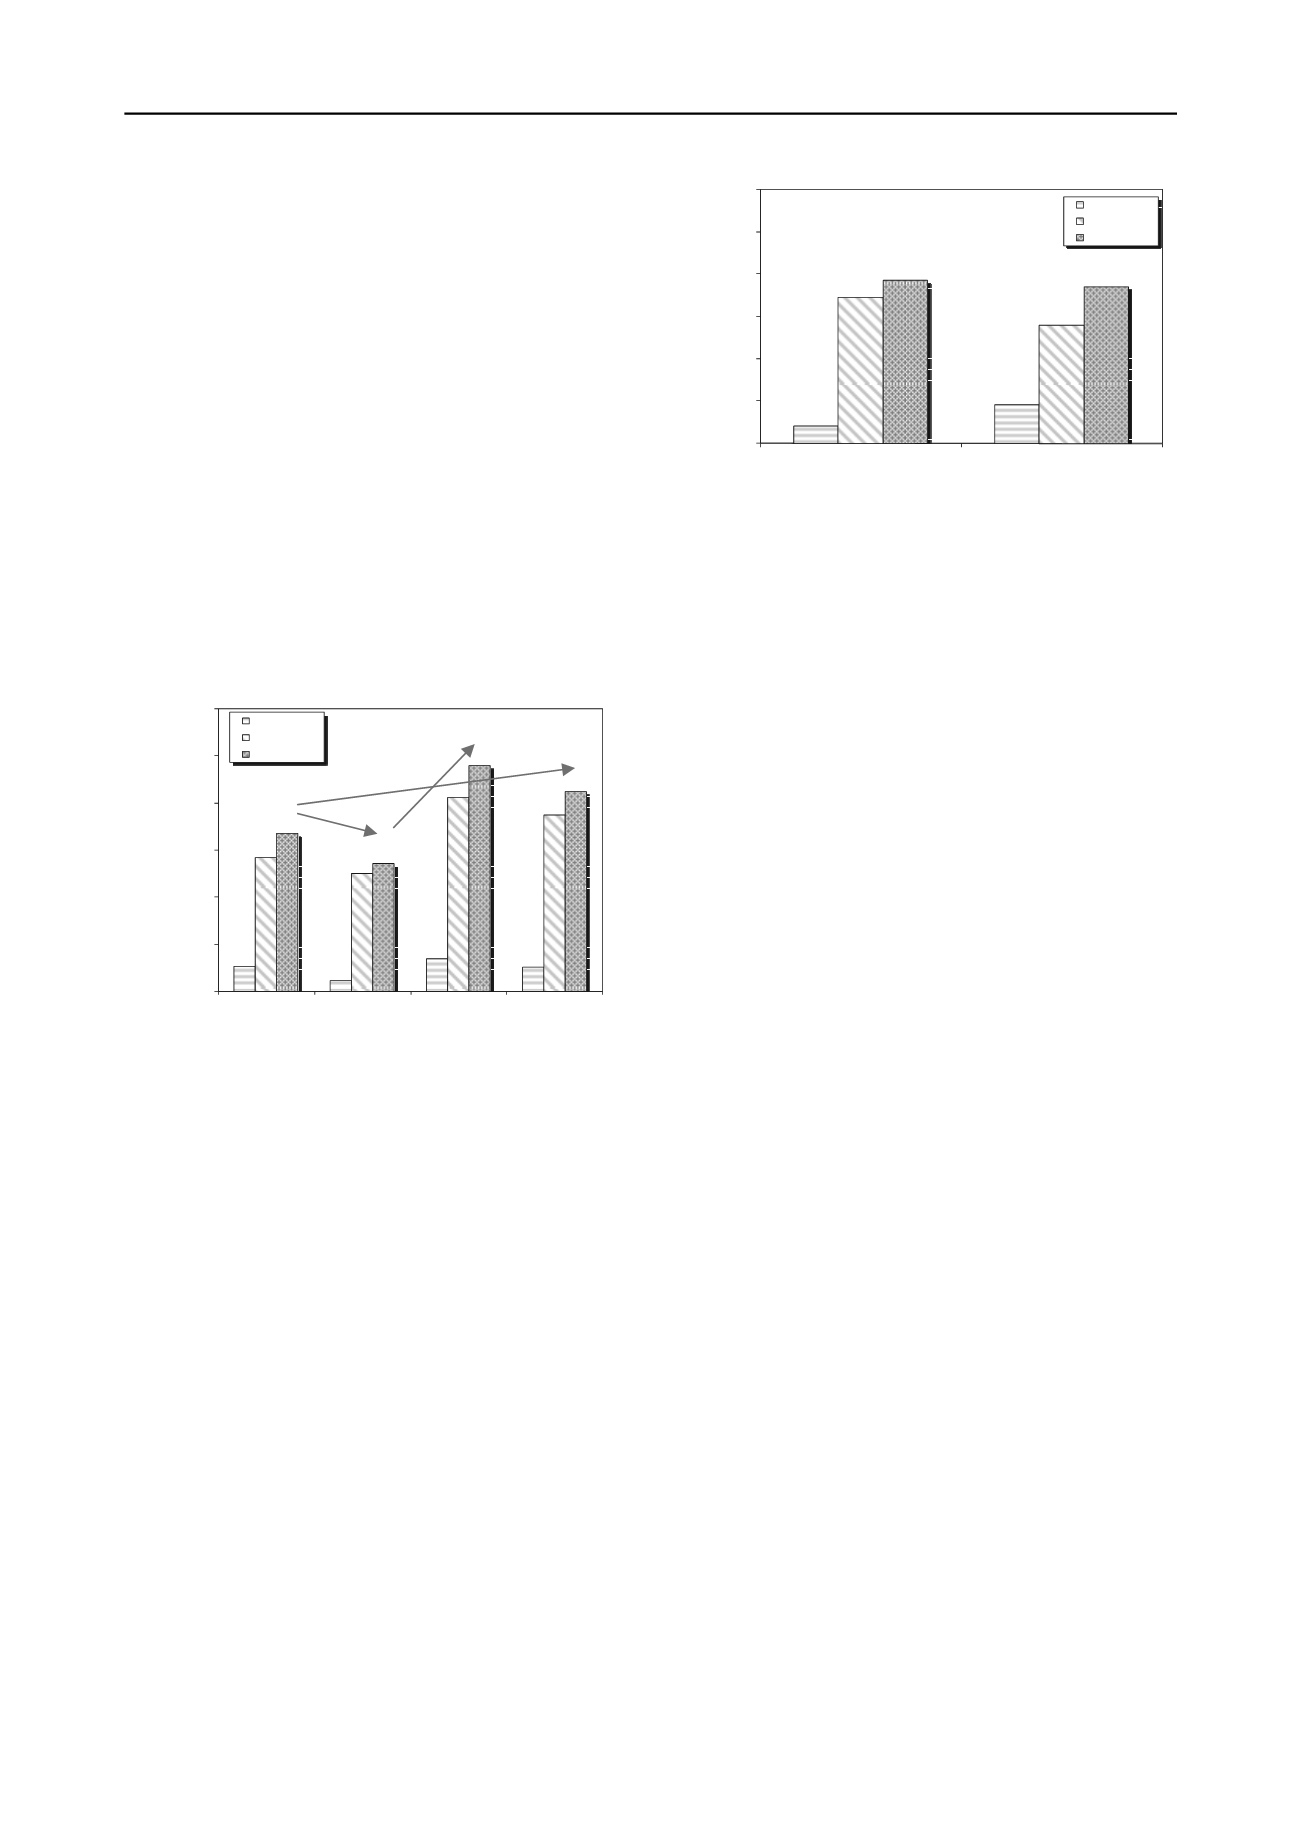
Figure 8. Comparison between monotonic components of
maximum total lateral forces in pile group of this experiment
and JRA 2002 recommended values.
ile in
upslope row) and P4 (the side pile in upslope row) shows
that the side pile receives larger force than the middle pile
by a factor of about 1.27. This phenomenon is called
neighboring effect.
4. CONCLUSIONS
0.026
0.011
0.034
0.025
0.142
0.125
0.206
0.187
0.168
0.136
0.213
0.00
0.05
0.10
0.15
0.20
P1
P2
P3
P4
Monotonic component ofmaxi
total lateral force (kN)
Pile
0.240
0.25
0.30
mum
Crust layer
Liq. layer
Total
3.6. Total lateral force exerted on the pile group
estimated by
Findings from a large scale shake table test on a stiff 3×3 pile
group are presented and disscussed. The results show that total
lateral forces due to lateral spreading on the pile group can be
well predicted by JRA 2002 design code. However, based on
the experimental results, lateral forces exerted on individual
piles of the group varries depending on the pile positions within
the group which is not considered by JRA code. The shadow
and neighboring effects are found to be responsible for such an
observation. It is recommended that this variation be considered
in design applications.
5. REFERENCES
Kramer S.L. and Elgamal, A. 2001. Modeling soil liquefaction hazards
for performance-based earthquake engineering. PEER report
2001/13, Pacific Earthquake Engineering Research Center, College
of Engineering, Univ. of California, Berkeley.
Figure 7. Comparison of maximum total lateral forces on
Hamada H., Yasuda S., Isoyama R. and Emoto K. 1986. Study on
Liquefaction Induced Permanent Ground Displacements. Research
report, Association for the Development of Earthquake Prediction,
Japan.
different piles of the group.
Tokimatsu K. and Asaka Y. 1998. Effects of Liquefaction-Induced
Ground Displacements on Pile Performance in the 1995 Hyogoken-
Nambu Earthquake. Special Issue of Soils and Foundations, pages
163–177.
Total lateral forces exerted on the group can be
adding all lateral forces exerting on individual piles of the
group. It should be noted that in this experiment, only one side
pile in upslope row of the group was instrumented but it was
assumed that the ratio of lateral forces on the side piles of other
rows to those of their corresponding middle piles is the same as
the ratio between piles P4 and P1. Total forces exerted on pile
group of this experiment are compared with those recommended
by JRA 2002 in Figure 8. According to this figure, total lateral
force exerted on the pile group is about 1.04 times the values
calculated using recommendations of JRA 2002. This difference
in total lateral forces is found to be negligible. But if only the
lateral forces from the liquefiable layer be considred the
differences will be more. However, the trend observed for the
non-liquefiable crust layer is completely different as the lateral
forces suggested by JRA [2002] is about 2.2 times the
experimental values. The reason is that passive pressure
recommended by JRA 2002 does not seem to be mobilized in
this experiment.
Eberhard Marc O., Baldridge S., Marshall J., Mooney W. and Rix J.
2010. USGS/EERI Advance Reconnaissance Team: TEAM
REPORT V 1.1, The MW 7.0 Haiti Earthquake of January 12,
2010.
Haeri S. M., Kavand A., Rahmani I. and Torabi H. 2012. Response of a
group of piles to liquefaction-induced lateral spreading by large
scale shake table testing. Soil Dynamics and Earthquake
Engineering 38, 25-45.
Motamed R. and Towhata I. 2010. Shaking table model tests on pile
groups behind quay walls subjected to lateral spreading. Journal of
Geotechnical and Geoenvironmental Engineering 136(3), 477-489.
Abdoun T., Dobry R., O’Rourke T. and Goh SH. 2003. Pile response to
lateral spreads: centrifuge modeling. Journal of Geotechnical and
Geoenvironmental Engineering 129(10), 869-678.
Ashford S. A., Juirnarongrit T., Sugano T. and Hamada M. 2006. Soil–
pile response to blast-induced lateral spreading. I: Field Test.
Journal of Geotechnical and Geoenvironmental Engineering 132(2),
152-162.
JRA. 2002. Seismic design specifications for highway bridges. Japan
Road Association, English version, Prepared by Public Works
Research Institute (PWRI) and Ministry of Land, Infrastructure and
Transport, Tokyo, Japan.
Iai S., Tobita T. and Nakahara T. (2005. Generalized scaling relations
for dynamic centrifuge tests. Geotechnique 55(5), 355-362.
Brandenberg S. J., Wilson D. W., and Rashid M. M. 2010. Weighted
residual numerical differentiation algorithm applied to experimental
bending moment data. Journal of Geotechnical and
Geoenvironmental Engineering 136(6), 854-863.


