 
          917
        
        
          Technical Committee 104 /


            Comité technique 104


          5.1


            Consolidation


          The first step in the centrifuge model test is to reconsolidate the
        
        
          clay model in-flight at an acceleration of 50 g, due to the
        
        
          increase in self-weight. Dissipation of the excess pore water
        
        
          pressures took approximately 13 h (Fig. 4).
        
        
          5.2


            Stone column installation


          The stone column installation tool developed by Weber (Fig. 5;
        
        
          Weber, 2008) has been used to construct the stone column. It
        
        
          consists of a steel tube with an outer diameter of 10 mm and an
        
        
          inner diameter of 8 mm. A drawing pin was used to prevent the
        
        
          tube from blocking during first penetration.
        
        
          Fig. 5: Stone column installation tool (Weber, 2008).
        
        
          The column tool was inserted up to a depth of 120 mm in the
        
        
          centre of the clay model and the column was built with a 15/10
        
        
          compaction regime (i.e. once the desired installation depth was
        
        
          reached, the tool was extracted by 15 mm before being inserted
        
        
          again 10 mm, compacting the sand in the column). This
        
        
          compaction process increases the stone column diameter to 12
        
        
          mm (see Fig. 1), at least in the softest clay layer near the
        
        
          surface. The insertion was displacement-controlled (2 mm/s)
        
        
          and the driving force as well as the pore water pressures were
        
        
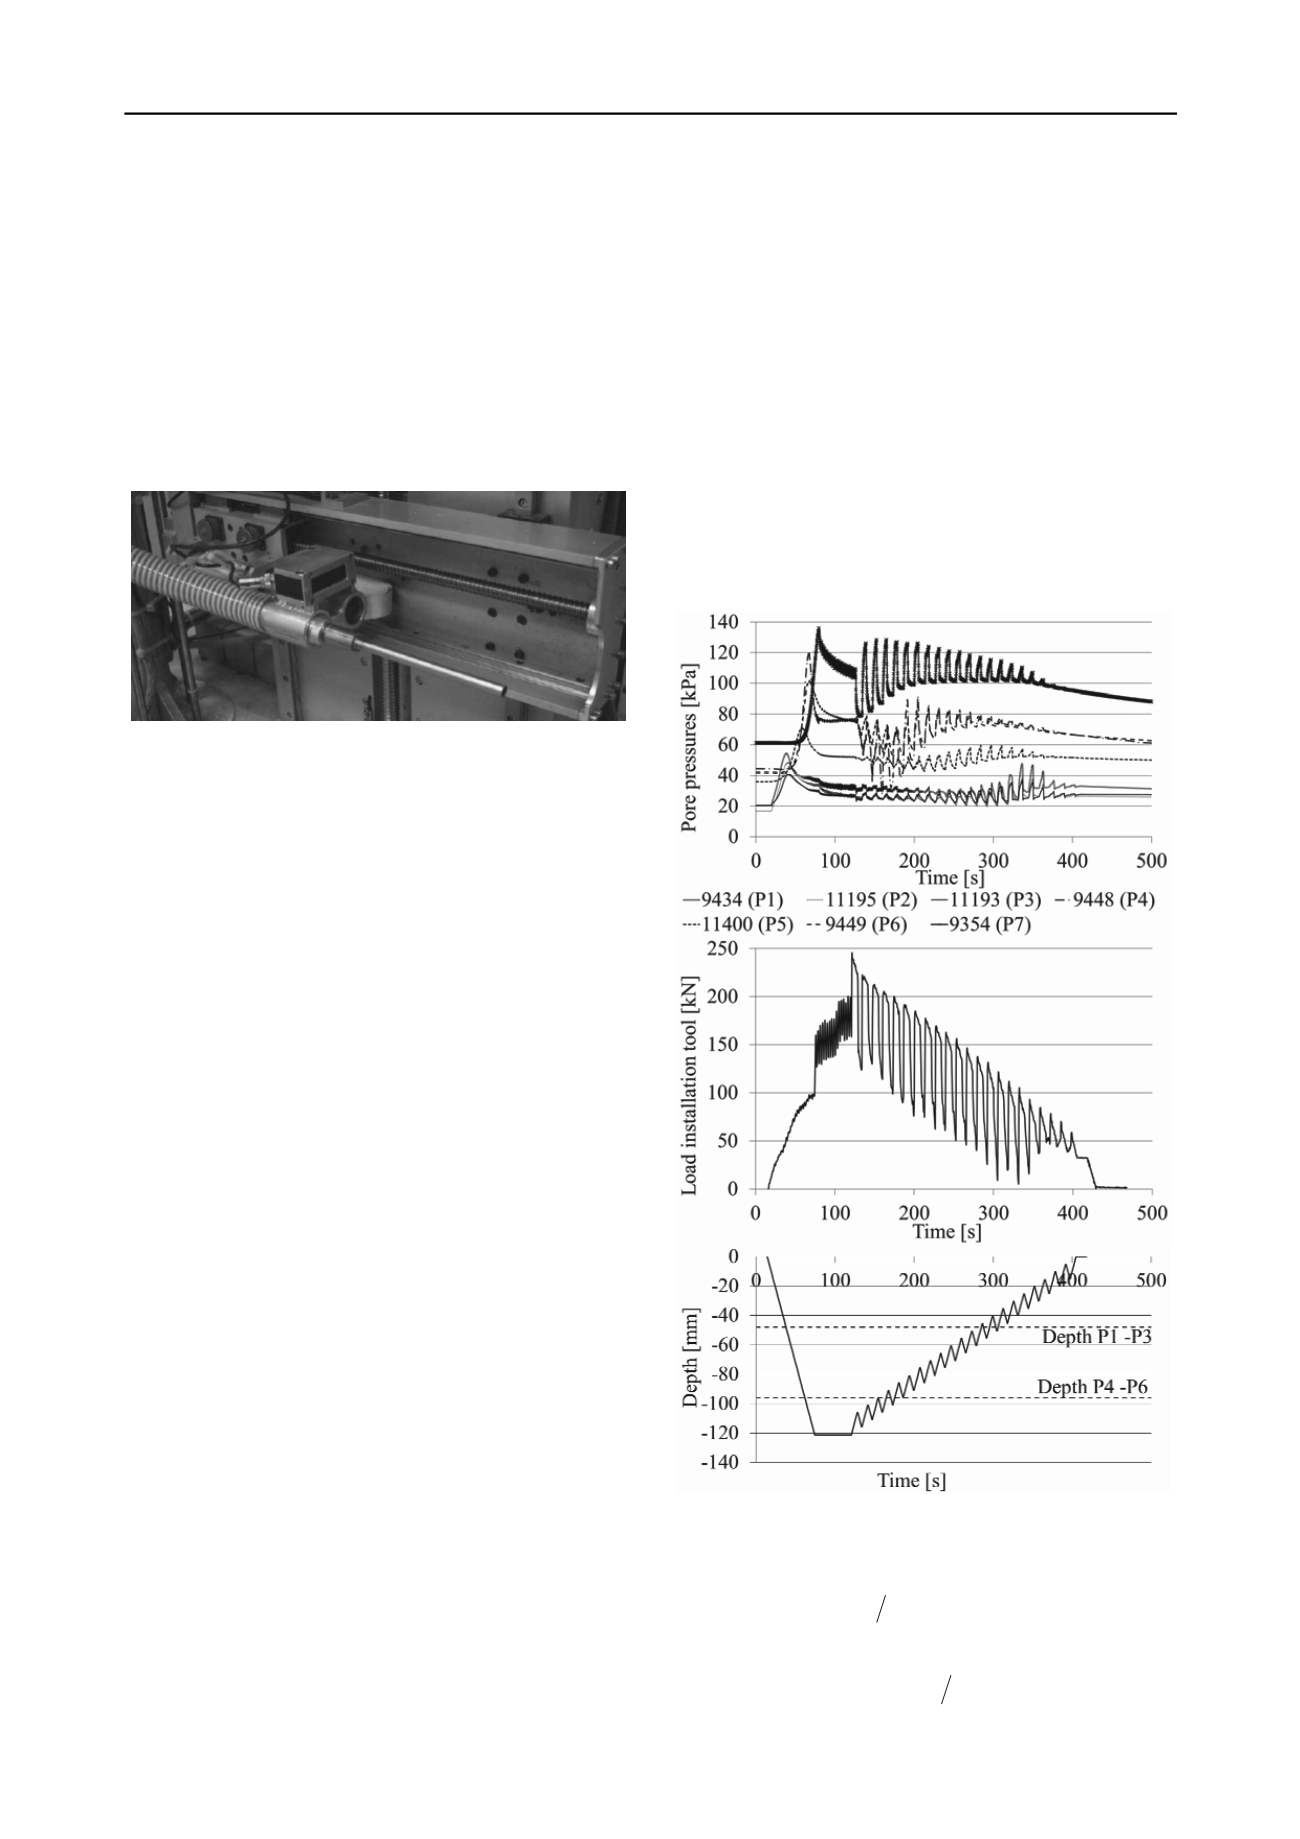
          recorded during this phase (Fig. 6). The development of pore
        
        
          water pressure over time is given in the top part of Fig. 6. The
        
        
          middle part of Fig. 6 shows the scaled driving force required to
        
        
          penetrate the installation tool and the bottom part shows the
        
        
          position of the tip of the installation tool under the surface. It
        
        
          can be seen that the strongest reaction of the PPTs is observed
        
        
          when the tip of the column tool reaches the depth of the sensors
        
        
          (marked by horizontal dashed lines in the Fig. 6c). This is
        
        
          observed both for the penetration phase and the compaction
        
        
          phase, respectively.
        
        
          90% of the excess pore water pressures are dissipated after
        
        
          about 2300 s, which, when scaled by 50
        
        
          2
        
        
          , corresponds to a
        
        
          prototype time of about 67 days. This is significantly shorter
        
        
          than the time needed for dissipation of excess pore pressures at
        
        
          the beginning of the test (see Fig. 4). Indeed, for a drainage path
        
        
          of 4 m (half of the prototype height of the model) and a one
        
        
          dimensional stiffness modulus M
        
        
          E
        
        
          = 1780 kPa, a coefficient of
        
        
          consolidation
        
        
          7 2
        
        
          2.67 10
        
        
          /


            v


            c


            m


          2
        
        
          /
        
        
          589


            d c


            s


            s


          is obtained, leading to a
        
        
          consolidation time at 90% excess pore water pressure
        
        
          dissipation of
        
        
          90
        
        
          90


            v


            v


            t


            T


          . This reduces the time
        
        
          by a factor of 8.8, which is consistent with a combined drainage
        
        
          condition, i.e., vertical plus radially outwards (to the
        
        
          surrounding Perth sand) and inwards (towards the stone
        
        
          column) resulting from the insertion of the granular column.


            day


          6 FOOTING LOADING
        
        
          As the third step in the test, the newly built stone column
        
        
          was loaded with a 56 mm-diameter stiff aluminium footing,
        
        
          after the excess pore water pressures caused by the installation
        
        
          of the column had dissipated. The loading was displacement-
        
        
          controlled (v = 0.02 mm/s) and a maximum settlement of
        
        
          17 mm at model scale was attained before the footing was
        
        
          removed and the loading-induced excess pore water pressures
        
        
          were left to dissipate. The first jump in excess pore water
        
        
          pressures (Fig. 7 top) between 0 and 1000 s is due to a technical
        
        
          problem, which triggered an unexpected loading of the stone
        
        
          column. The actual loading can thus be studied after 1000 s.
        
        
          The sensors P1 (top layer close to the column) and the
        
        
          sensors P4, P5 and P6 in a depth of 96 mm below ground
        
        
          surface react in parallel to the loading, albeit with different
        
        
          magnitudes of pore pressure change, while P2 and P3 exhibit a
        
        
          less sharp response. This confirms that the column takes a larger
        
        
          part of the load than the soft clay and the pressure distribution
        
        
          with depth is not building up as it would in a homogeneous
        
        
          medium. Secondly, an explanation was sought for the increase
        
        
          (P1 to P6) or drop (P7) in pore water pressures that can be seen
        
        
          at about 1500 s, which might have coincided with failure of the
        
        
          column. A bulge could be identified in the upper third of the
        
        
          column as the model was being dismantled. The cause might be
        
        
          attributed to the development of this ‘local compression failure
        
        
          zone’ in the sand column.
        
        
          (a)
        
        
          P7
        
        
          P4-P6
        
        
          P5
        
        
          P1-P2-P3
        
        
          (b)
        
        
          (c)
        
        
          Fig. 6: (a) Pore water pressures, (b) driving force (c) depth of the tip of
        
        
          the installation tool during the sand column installation.
        
        
          The total load applied on the footing can be formulated as
        
        
          (Adam, 2011):


            v


            sc sc


            clay clay


            sc


            clay


            A


            A A A


          (1)
        
        
          with the
        
        
          corresponding load on the stone column as (Adam,
        
        
          2011):


          '
        
        
          '
        
        
          1 sin
        
        
          2
        
        
          1 sin


            sc


            sc


            clay


            clay


            sc


            c


          (2)