 
          921
        
        
          Technical Committee 104 /


            Comité technique 104


          pile cap displacement reached its maximum displacement a few
        
        
          seconds after the shaking and then bounced back gradually
        
        
          having a residual displacement of about 9 mm. The maximum
        
        
          ground surface displacement was about 5.0 cm while the
        
        
          maximum displacement of the cap was about 5.4 cm.
        
        
          -1
        
        
          0
        
        
          1
        
        
          2
        
        
          3
        
        
          4
        
        
          5
        
        
          6
        
        
          0 1 2 3 4 5 6 7 8 9 10 11 12 13 14


            Displacement(cm)


          Groundsurface
        
        
          -2
        
        
          -1
        
        
          0
        
        
          1
        
        
          2
        
        
          3
        
        
          4
        
        
          5
        
        
          6
        
        
          0 1 2 3 4 5 6 7 8 9 10 11 12 13 14


            Displacement(cm)


            Time (sec)


          Figure 4. Time histories of ground surface and lateral pile cap
        
        
          displacements.


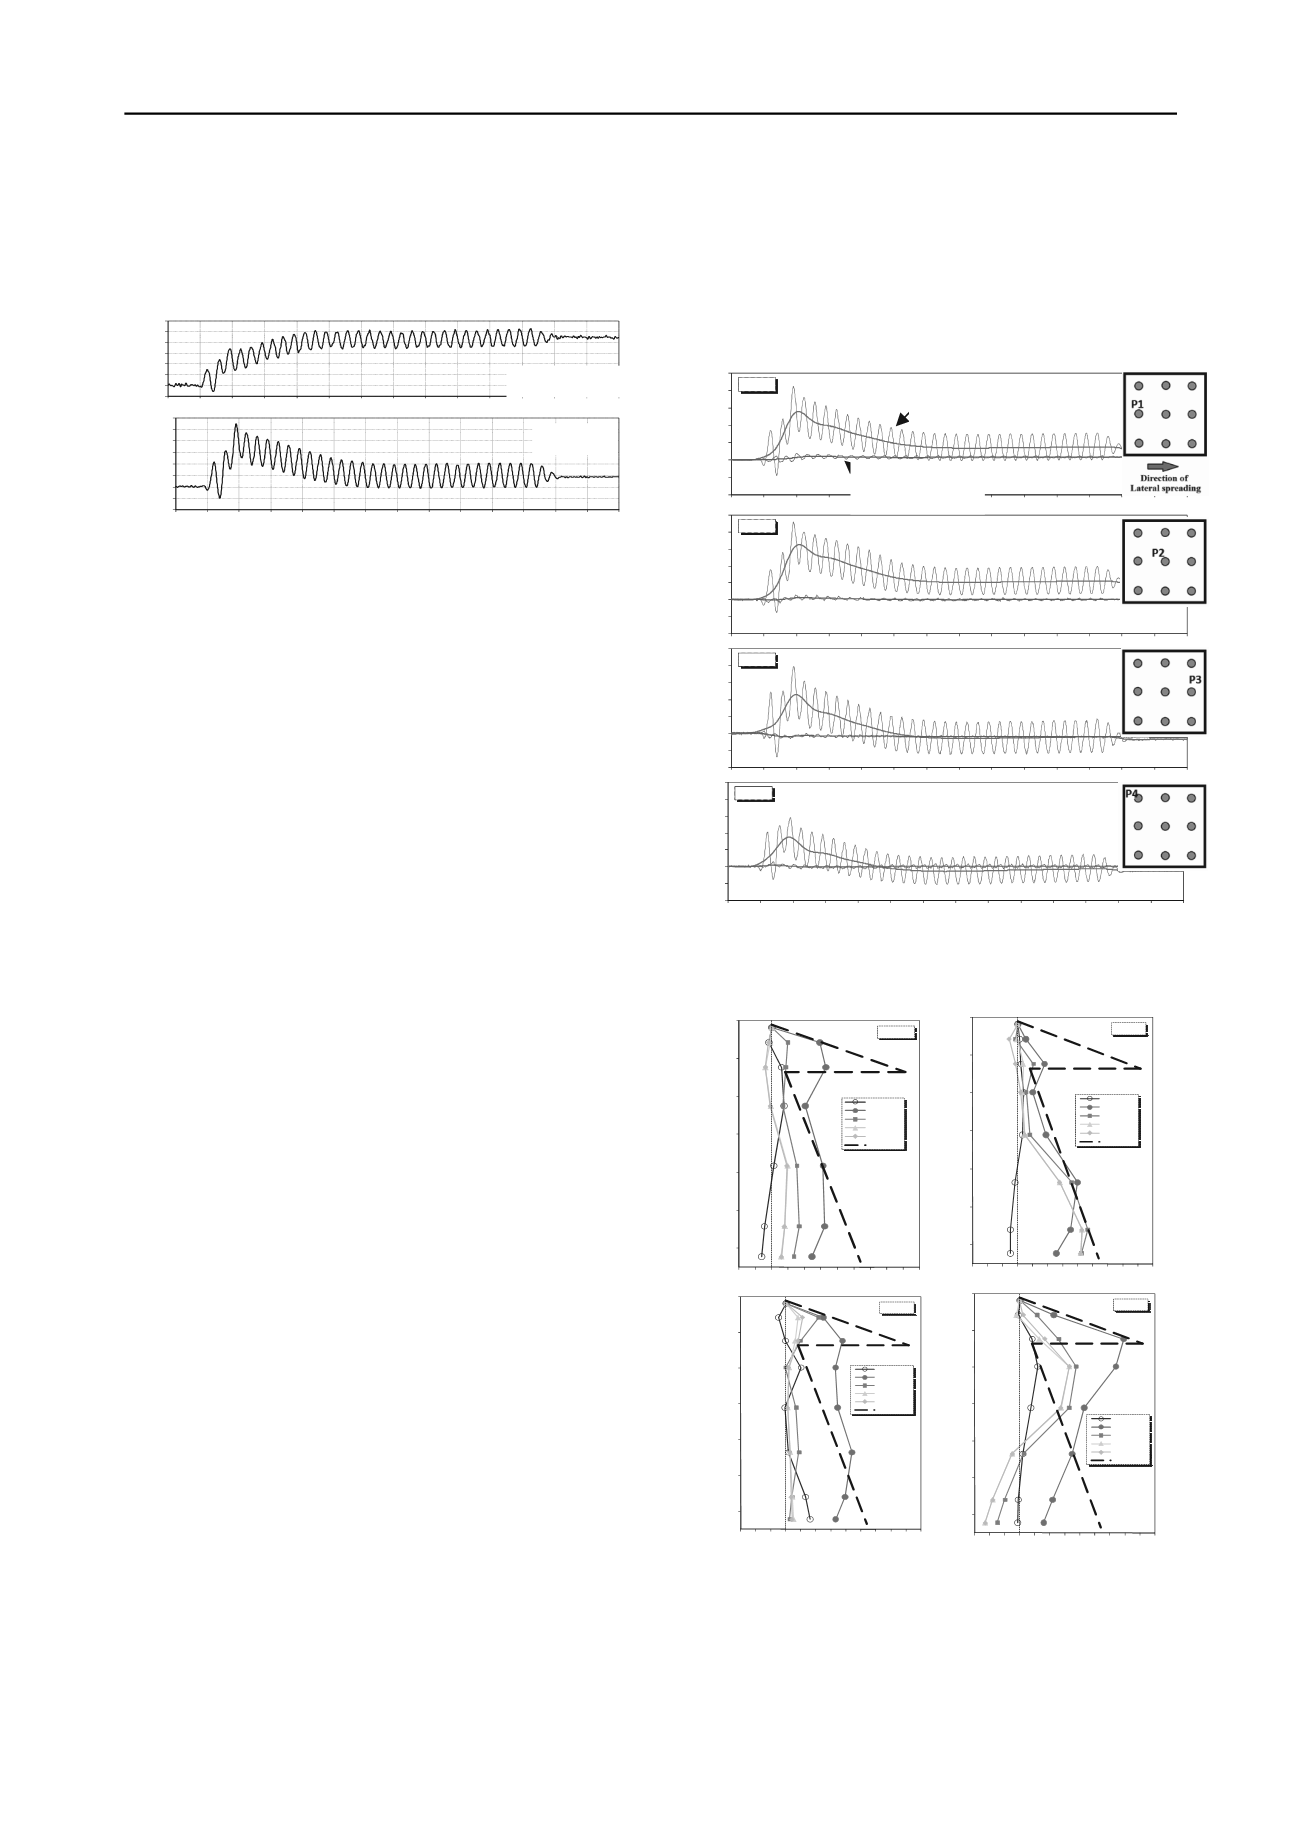
            3.4. Pile bending moments


          Figure 5 shows time histories of bending moments in
        
        
          instrumented individual piles of the group at some
        
        
          representative depths, i.e. at base of the liquefiable layer and
        
        
          near the connection of piles to the cap.  As seen, after lateral
        
        
          spreading that occurred about t=1.5 sec, bending moments
        
        
          increases significantly. However, during liquefaction, the soil
        
        
          loses most of its shear resistance; hence it fails and gradually
        
        
          moves around the piles. This movement reduces the lateral
        
        
          pressure on the piles; therefore the piles bounce back towards
        
        
          upslope due to their rigidity as the shaking continued. Due to
        
        
          this elastic rebound, bending moments in piles descend as well.
        
        
          It should be noted that time histories of bending moments in all
        
        
          piles consist of a cyclic component due to dynamic soil
        
        
          pressures as well as a monotonic component from the kinematic
        
        
          lateral soil pressures during lateral spreading. An interesting
        
        
          observation is that maximum positive bending moments differ
        
        
          in individual piles of the group depending on their position
        
        
          within the group.
        
        
          4 LATERAL PRESSURE OF LIQUEFIED SOIL ON THE
        
        
          PILES
        
        
          The lateral pressures exerted on the individual piles of the
        
        
          groups were back-calculated from the monotonic component of
        
        
          bending moment data using the method introduced by
        
        
          Brandenberg et al. (2010). Figure 6 shows profiles of the
        
        
          monotonic component of back-calculated lateral pressures of
        
        
          liquefied soil along with the lateral forces proposed by JRA
        
        
          (2002) code for design of pile groups against lateral spreading.
        
        
          This code recommends using 30% of the total overburden
        
        
          pressure to be applied to the outermost width of the pile group
        
        
          as lateral forces due to lateral spreading. In cases with a top
        
        
          non-liquefiable layer, it suggests that the passive pressure from
        
        
          non-liquefiable layer should be considered as well. For design
        
        
          applications, implementing JRA (2002), it is assumed that the
        
        
          total lateral force exerted on the pile group is equally distributed
        
        
          among the individual piles of the group.
        
        
          According to Figure 6, at the early stages of shaking when the
        
        
          soil was not yet liquefied, induced pressures are negligible. But
        
        
          upon liquefaction and lateral spreading, magnitude of lateral
        
        
          pressures increased significantly. In all diagrams, an increase in
        
        
          applied lateral pressures is observed at upper elevations where
        
        
          the non-liquefiable crust exists. In fact, the non-liquefiable crust
        
        
          moved with the underlying liquefied layer towards the
        
        
          downslope during lateral spreading, exerting extra pressures on
        
        
          the piles. As seen in Figure 6, the magnitude of lateral pressures
        
        
          on pile 3 (the downslpe pile) in upper elevations are greater than
        
        
          of the soil from the downslope side of pile 3 during lateral
        
        
          spreading resulting in lack of lateral support. The agreement
        
        
          between the magnitudes and patterns of back-calculated lateral
        
        
          pressures with the values recommended by JRA 2002 is
        
        
          reasonable except in pile 3 which shows significant difference
        
        
          with JRA 2002 values in terms of pressure magnitude and
        
        
          pattern.
        
        
          -0.1
        
        
          -0.05
        
        
          0
        
        
          0.05
        
        
          0.1
        
        
          0.15
        
        
          0.2
        
        
          0.25


            Bendingmoment(kN.m)


            Pile P1


          Ground surface
        
        
          those of the other piles which can be attributed to the separation
        
        
          -0.1
        
        
          -0.05
        
        
          0
        
        
          0.05
        
        
          0.1
        
        
          0.15
        
        
          0.2
        
        
          0.25


            Bendingmoment(kN.m)


            Pile P2


          -0.1
        
        
          -0.05
        
        
          0
        
        
          0.05
        
        
          0.1
        
        
          0.15
        
        
          0.2
        
        
          0.25


            Bendingmoment(kN.m)


            Pile P3


          -0.1
        
        
          -0.05
        
        
          0
        
        
          0.05
        
        
          0.1
        
        
          0.15
        
        
          0.2
        
        
          0.25
        
        
          0 1 2 3 4 5 6 7 8 9 10 11 12 13 14


            Bendingmoment(kN.m)


            Time (Sec)


            Pile P4


          Figure 5. Time histories of bend
        
        
          tative
        
        
          ing moments in represen
        
        
          individual piles of the group.
        
        
          0
        
        
          0.2
        
        
          0.4
        
        
          0.6
        
        
          0.8
        
        
          1
        
        
          1.2
        
        
          -2 -1 0 1 2 3 4 5 6 7 8 9


            Depth (m)


            Pile P1


          t=1sec
        
        
          t=2sec
        
        
          t=4sec
        
        
          t=8sec
        
        
          t=12sec
        
        
          JRA
        
        
          0
        
        
          0.2
        
        
          0.4
        
        
          0.6
        
        
          0.8
        
        
          1
        
        
          1.2
        
        
          -3 -2 -1 0 1 2 3 4 5 6 7 8 9


            Depth (m)


            Pile P2


          t=1sec
        
        
          t=2sec
        
        
          t=4sec
        
        
          t=8sec
        
        
          t=12sec
        
        
          JRA
        
        
          0
        
        
          0.2
        
        
          0.4
        
        
          0.6
        
        
          0.8
        
        
          1
        
        
          1.2
        
        
          -3 -2 -1 0 1 2 3 4 5 6 7 8 9


            Depth (m)


            Monotonic soilpressure (kPa)


            Pile P4


          t=1sec
        
        
          t=2sec
        
        
          t=4sec
        
        
          t=8sec
        
        
          t=12sec
        
        
          JRA
        
        
          0
        
        
          0.2
        
        
          0.4
        
        
          0.6
        
        
          0.8
        
        
          1
        
        
          1.2
        
        
          -3 -2 -1 0 1 2 3 4 5 6 7 8 9


            Depth (m)


            Monotonic soilpressure (kPa)


            Pile P3


          t=1sec
        
        
          t=2sec
        
        
          t=4sec
        
        
          t=8sec
        
        
          t=12sec
        
        
          JRA
        
        
          Figure 6. Profiles of lateral soil pressures on individual piles of


            3.5. Total lateral forces exerted on individual piles


          ces exerted
        
        
          the group during lateral spreading.
        
        
          Monotonic components of maximum total lateral for
        
        
          on the piles were calculated by integrating the lateral soil
        
        
          pressures along the piles. These total lateral forces were
        
        
          Depth=125cm
        
        
          Pile cap
        
        
          Depth=124cm