925
Technical Committee 104 /
Comité technique 104
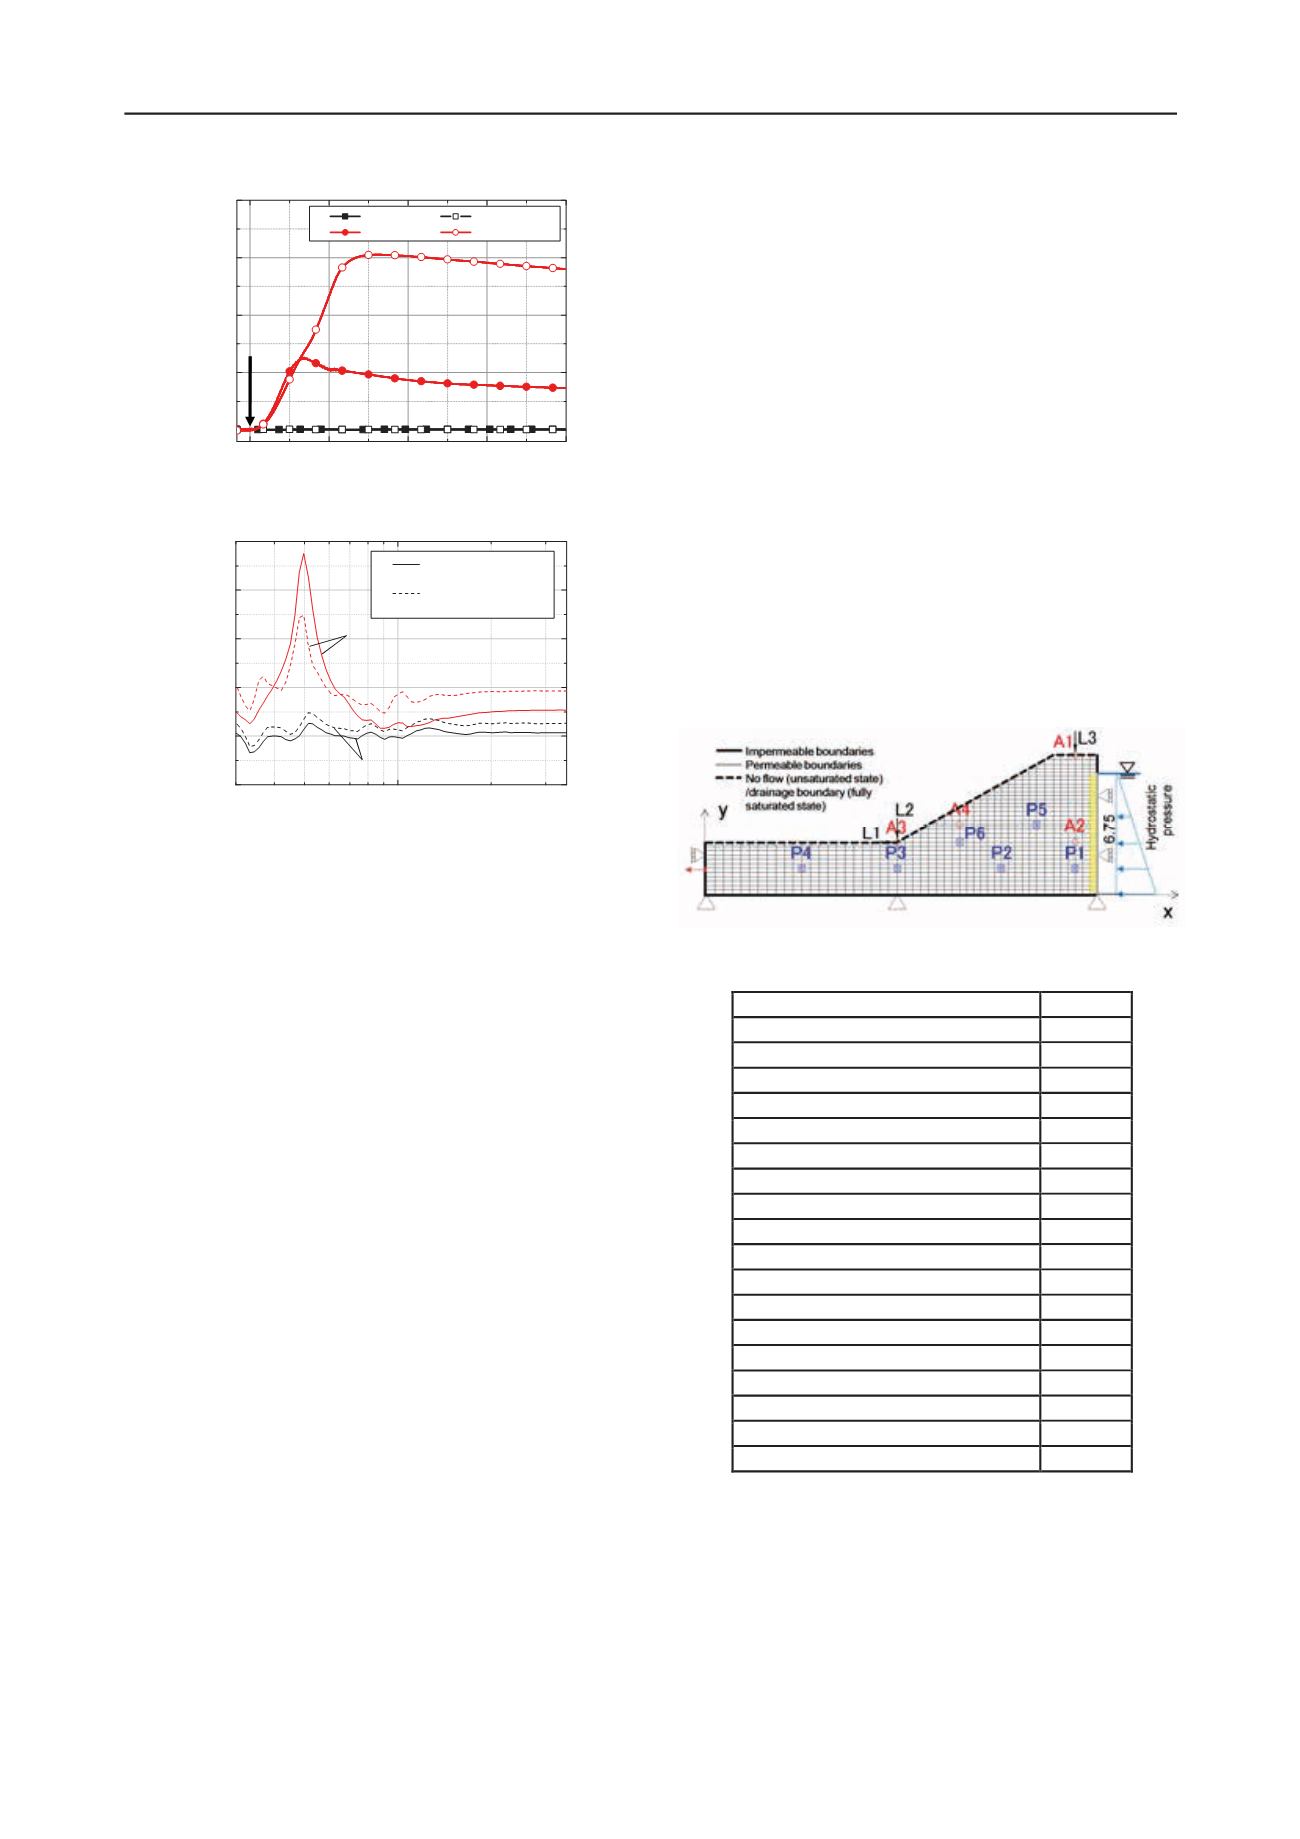
Figure 5. Excess pore water pressure-time profile
Figure 6. Acceleration response spectrum (measured-input ratio)
Fig. 6 shows the acceleration response spectrum, namely,
measured-input ratio, calculated using the EMPR program
developed by Sugito et al. (2000) at the crest and in the
embankment. Damping parameter used in this analysis is 0.05.
The higher amplification occurs in Case 2 than Case 1, and the
predominant period is about 0.5sec. This is probably because of
the reduction in the strength and the stiffness of the
embankment due to the infiltration.
3 NUMERICAL SIMULATION OF THE DYNAMIC
CENTRIFUGAL MODEL TESTS
3.1
Multi-phase coupled liquefaction-analysis method for
elasto-plastic unsaturated soils
In the formulation of the dynamic coupled analysis, the
simplified three-phase method is used in which the
compressibility of air is assumed to be very high, whereas the
soil particle and the pore water are incompressible as compared
with the air (Oka et al. 2007, 2008, Kato et al. 2009), namely,
the three-phase method can be simplified into the soil-water
coupled two-phase mixture theory. A cyclic elasto-plastic model
based on the non-linear kinematic hardening rule (Oka et al.,
1999) was used in the analysis with a modified plastic
dependency of the modulus, into which the non-linear
hardening rule was incorporated. As the stress variable of the
constitutive model, the skeleton stress is used in order to
describe the mechanical behavior of unsaturated soils (e.g., Oka
et al. 2007, 2008, Oka and Kimoto 2012). Skeleton stress tensor
′
is defined as follows:
′
,
1
(1)
where
is the total stress tensor,
is Kronecker’s delta,
is the average fluid pressure,
is the pore water pressure,
is the pore air pressure, and
is the degree of saturation. For
the full description of the behavior of unsaturated soil, it is
necessary to incorporate the suction in the constitutive model.
A u-p formulation for the liquefaction analysis (Oka et al.,
2004) is adopted to solve the governing equations, in which the
displacement of the solid phase and the pore pressure are used
as independent variables. In the present analysis, the finite
element method was used for the spatial discretization of the
equation of motion for the whole mixture, and the finite
difference method was used for the discretization of the
continuity equation for the water phase.
3.2
Analysis model and the boundary conditions
Figure 7 shows the analysis model of the embankment and the
finite element meshes used in the analysis. The embankment is
initially unsaturated with an initial suction of 3.21 kPa
corresponding to the initial degree of saturation of 67.8%. The
right boundary is partly drainage one in order to simulate the
water supply with the hydrostatic pressure. After the simulation
of the water infiltration for 24 hours, dynamic analysis with the
same input wave as in the experiment has been performed.
Material parameters used in this analysis are listed in Table 3.
The permeability coefficients of the elements just close to the
drainage boundary are 10 times lower than the other parts
because the water is likely to flow between the soil and the wall
of the model container. The bulk modulus of the pore fluid of
5,000 kPa is lower than that of the water in order to model the
mixture of the pore water and the pore air since the unsaturated
seepage flow was observed in the experiment.
Figure 7 Analysis model and the boundary conditions
Table 3 Material parameters
Initial void ratio
0.589
Compression index
λ
0.0804
Swelling index
0.0001
Elastic shear modulus
⁄
4000
Permeability
(m/s)
4.79×10
-5
Bulk modulus of pore fluid
(kPa)
6000
Phase transformation stress ratio
∗
1.270
Failure stress ratio
∗
1.270
Kinematic hardening parameter
∗
10000
Kinematic hardening parameter
∗
150
Kinematic hardening parameter
50
Quasi-overconsolidation ratio
1.3
Anisotropy parameter
2000
Dilatancy coefficient
∗
1.0
Dilatancy coefficient
2.0
Referential strain parameter
∗
0.008
Referential strain parameter
∗
0.08
van Genuchten’s parameter
(1/m)
19.6
van Genuchten’s parameter
′
1.2
3.3
Simulation results
Figure 8 shows the time profile of the pore water pressure
during the seepage process. Comparing with the test results
shown in Figure 2, the pore water pressure level at P1, P2, and
P3 of the simulation results are higher than those of the test
results. Meanwhile, the seepage area shown in Figure 9 is
almost the same as that observed in the test (Figure 3). Namely,
the unsaturated seepage flow was observed in experiment, while
the fully saturated flow is obtained by this analysis. In this
analysis, the unsaturated seepage flow has been modeled by the
reduction of the bulk modulus of the pore fluid.
0
30
60
90
120
0
5
10
15
20
P 1 Case 1
P 4 Case 1
P 1 Case 2
P 4 Case 2
Pore pressure (kPa)
Time (sec)
Onset of
seismic
loading
1
0
1
2
3
4
5
Measure-input ratio
Period (sec)
Accelerometer 1
(at the crest)
Accelerometer 4
(in the embankment)
0.3
Case 2
Case 1


