955
Technical Committee 104 /
Comité technique 104
Proceedings of the 18
th
International Conference on Soil Mechanics and Geotechnical Engineering, Paris 2013
The tank was filled with sand in multiple lifts. The height of
each lift was equal to the foundation width. The mass of soil for
each layer was determined from the required density. Soil was
poured through a funnel moving around the tank and to achieve
a uniform density, a specific height of fall was maintained. A
wooden float was used to compact and level the soil top after
every lift. The density achieved by compaction was checked by
putting square cans at various levels and reasonable accuracy
was observed. Water was supplied through rubber tubing
attached to a nozzle located at the bottom of the tank. Water
table was raised at a lift height of 100 mm (foundation width,
B
)
from the bottom of the tanks up to a depth of
B
below the
footing level. Then the rise was reduced to
B
/5 until the water
table reached footing level. The height of water table rise was
monitored by a glass tube attached to the soil tank. The load
was applied with a hydraulic jack. Settlement for each water
table lift was obtained by averaging the two dial gauge readings
placed on top of the footings. Figure 2 shows a close view of
the experimental setup used in the tests.
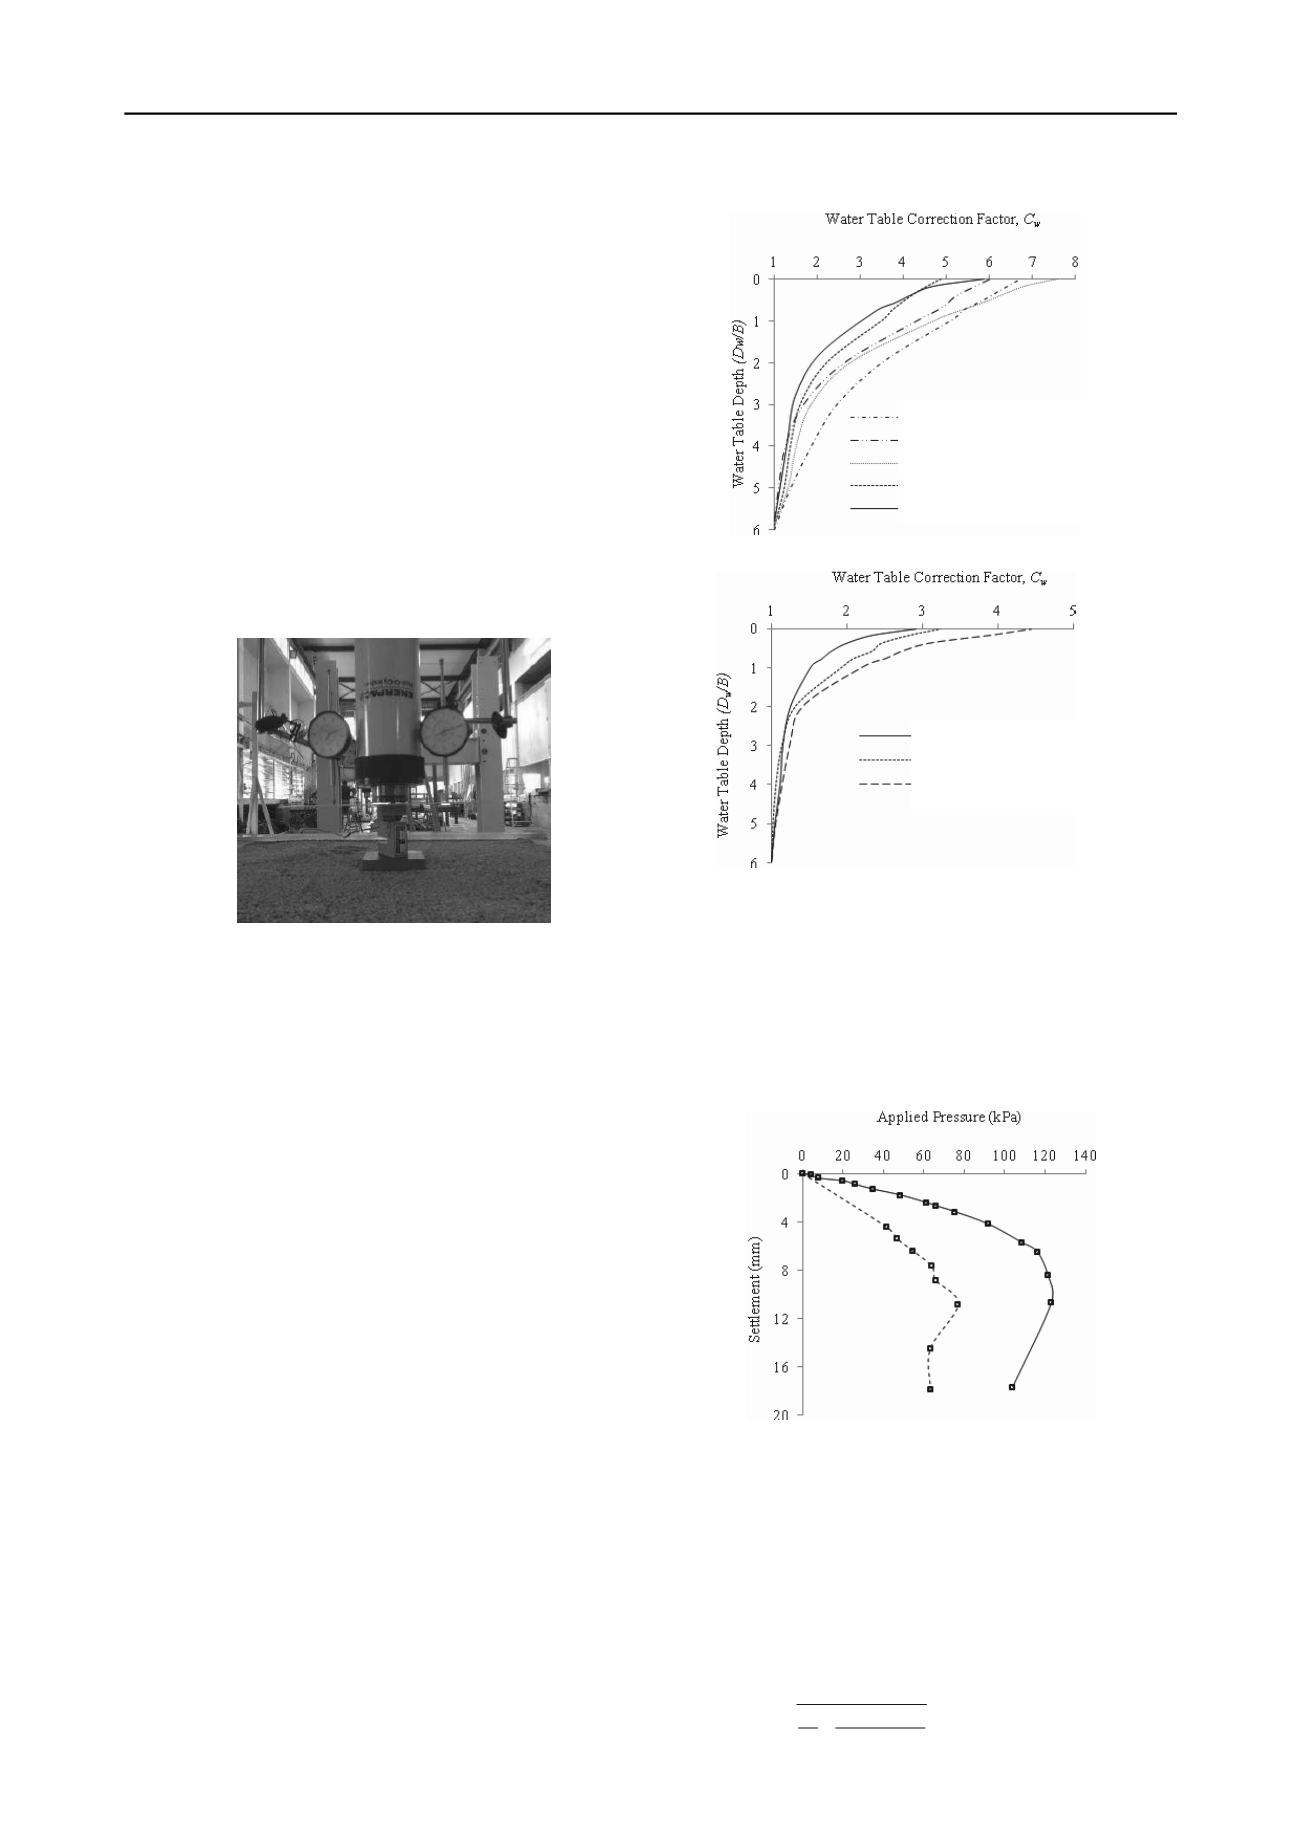
Rectangular Footing (
B/L
=0.25)
Rectangular Footing (
B/L
=0.5)
Square Footing (
B/L
=1.0)
Rectangular Footing (
B/L
=0.75)
Circular Footing
(a)
Square Footing (
B/L
=1.0)
Rectangular Footing (
B/L
=0.5)
Circular Footing
Figure 2. Experimental Setup with model footing, dial gauges and
loading arrangement.
Initially, pressure-settlement curves were obtained for each
case by applying vertical pressure in increments and measuring
corresponding settlements in dry condition. Then double tangent
method was used to determine bearing capacity of the footings.
This means the ultimate bearing capacity was taken as the
intersection of the two tangents drawn from the two linear
segments of the load-settlement plot. The working load was
taken as one-third of the bearing capacity, keeping the factor of
safety at 3. In the next step, the footings were subjected to
working loads and the water level was raised gradually from
bottom of the tank up to the footing level.
4 INTERPRETATION OF EXPERIMENTAL RESULTS
From the additional settlements measured at various water table
depths, the water table correction factor diagrams were
obtained. Figure 3 shows the correction factor diagrams for
various footing shapes in loose and dense condition. The figure
shows that the additional settlement due to water table rise is
higher in loose sands, with
C
w
ranging from 4.9 to 7.6 times the
settlement in dry condition. Footings on dense sand experienced
less additional settlements than in loose sands, with
C
w
ranging
from 2.9 to 4.4. The results indicate significantly higher
additional settlement due to rise in water table than what was
suggested by Terzaghi (1943).
It is evident from the curves in Figure 3 that the increment
in correction factor is not linear with water table rise, instead,
settlement increases at a faster rate when the water table gets
closer to the footing. The stress level immediately below the
footing is very high, which causes significant additional
settlements.
Figure 4 shows the load-settlement curves for square
footing resting on dense sand in dry (solid line) and submerged
Figure 3. Water table correction factor diagrams for model footings on
a) loose sand, b) dense sand.
(b)
condition (dotted line). It shows that the additional settlement in
submerged sand rises from 2.92 to 3.25 times as the applied
pressure rises from 40 kPa to 75 kPa. This reflects the effect of
stress level on additional settlement due to submergence. The
bearing capacity of soil gets reduced while submerged, which
induces high additional settlements at higher stresses.
Figure 4. Applied pressure-settlement curves for 100 mm square footing
in dry and submerged condition.
5 NUMERICAL MODELING OF EXPERIMENTAL
SETUP
The authors modeled the experimental setup in FLAC 6.0
(Itasca, 2008), a finite difference code used in geotechnical
modeling. A hyperbolic non-linear elastic model was used in the
simulation. The model relies on the nonlinear stress-strain
relationship suggested by Kondner and Zelaska (1963):
max 3
1
3
1
)
(
1
)
(
i
E
(2)


