963
Technical Committee 104 /
Comité technique 104
asperity is created on the infill material. The upper mould is
now placed over the lower mould with the help of the guide rod
and movable screw the correct placement and thickness of the
infill material is insured. The whole assembly is now
compressed from the top with the help of C- clamp, after 30
minutes the sample is removed from the mould and kept for air
curing for 7 days before testing.
3 SHEAR BEHAVIOUR
ferent initial normal stress (P ) ranging from
0.1
d is having the facility to collect data and plot online
gra
actuator to provide the programmed
for
ck joints are set to be 8 kN/mm
y condition.
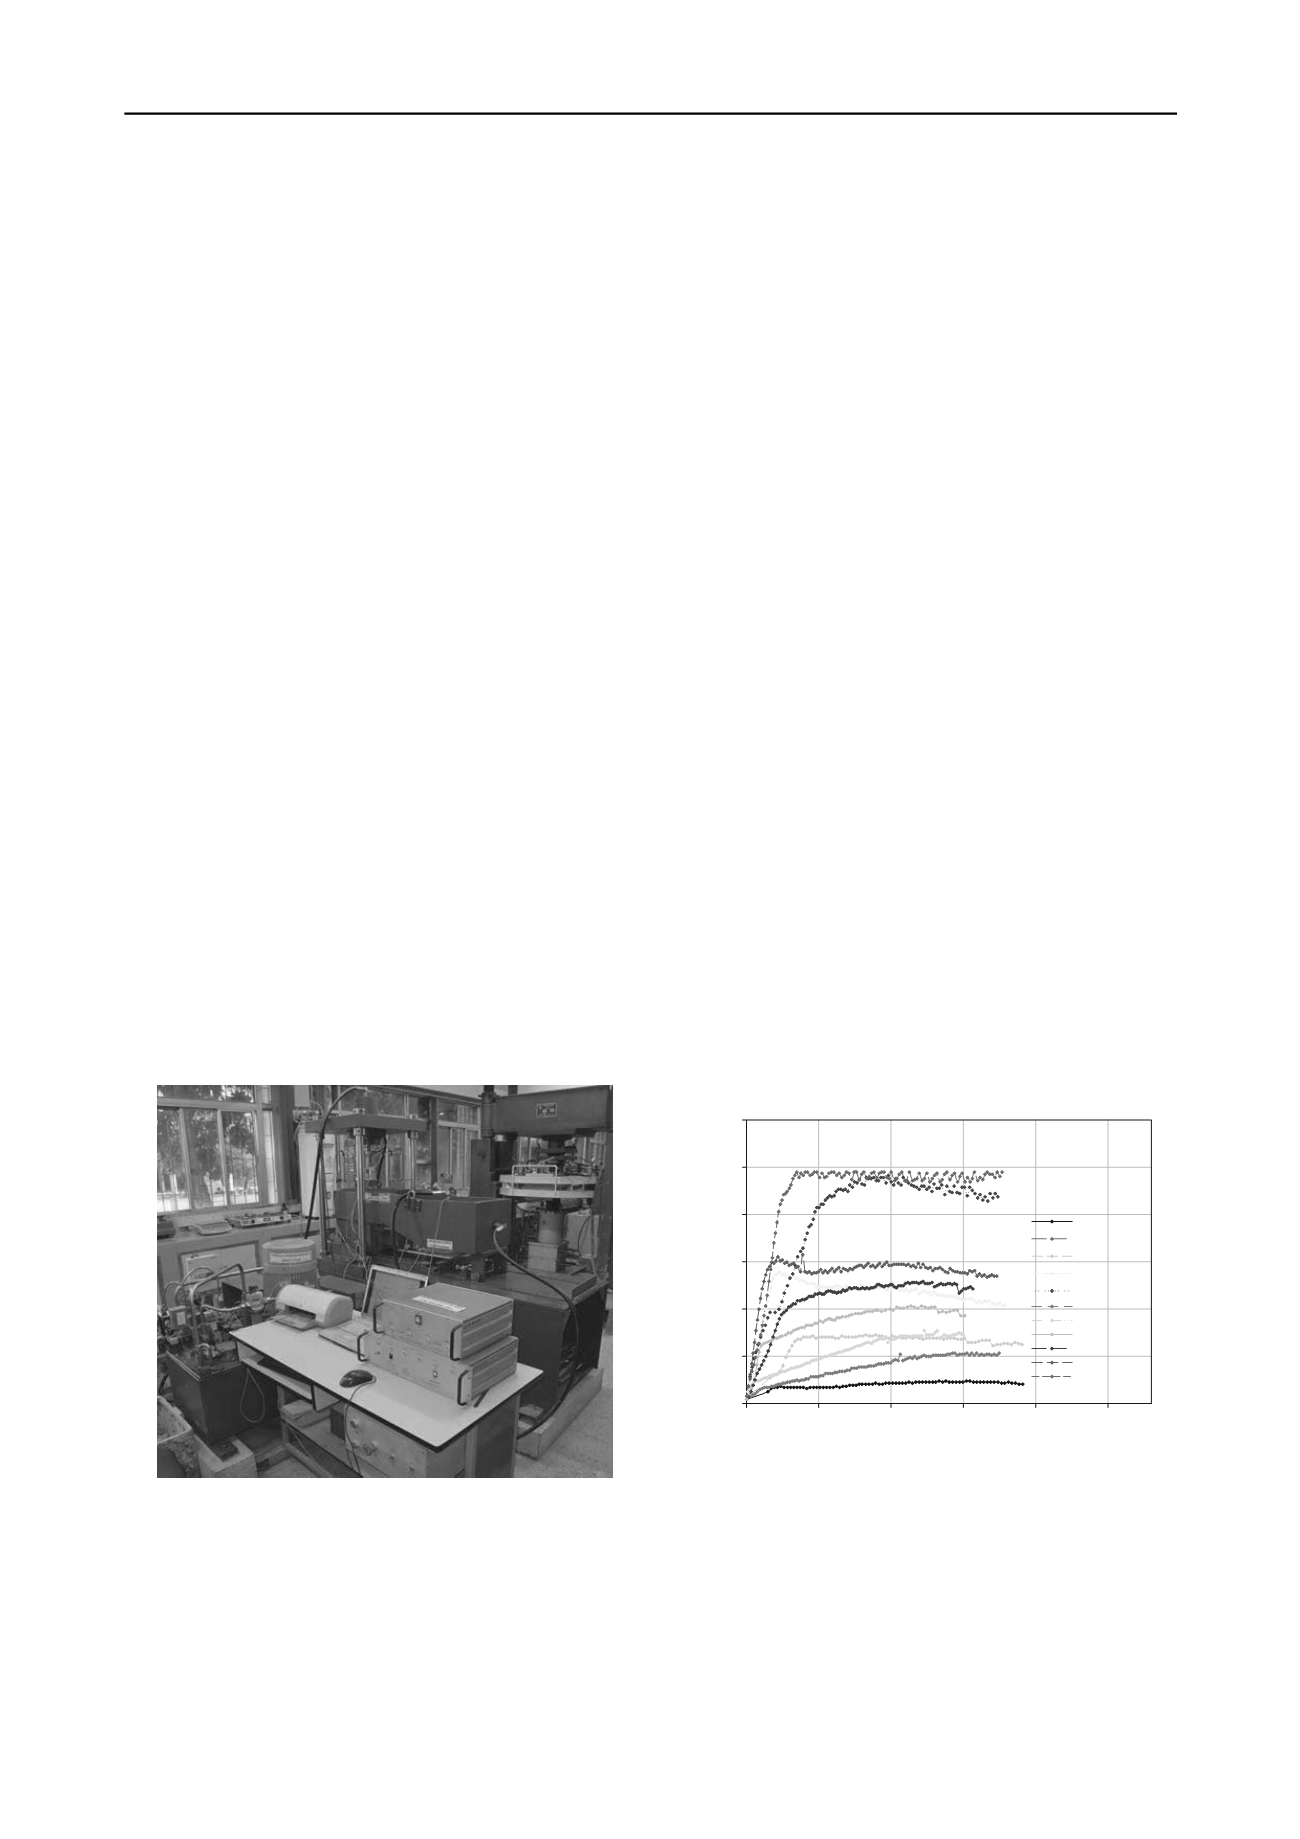
view of large scale direct shear machine (Rao and
Shr stava 2009).
ate of shearing is
maintained as 0.5mm/min during each test.
To study the effect of CNS boundary condition and infill
material on the shear behaviour of the rock joints the extensive
tests were planned and conducted under different boundary
conditions on the equipment designed and developed by the
authors as shown in Fig. 2, on 15
0
-15
0
asperity unfilled and
infilled joint at dif
i
to 2.04 MPa.
In this equipment Normal and shear load is applied through
an electro hydraulic servo actuator unit which works on closed
loop principle. The displacements are measured by LVDT’s
mounted on the specimen. The data acquisition system has 16
channels, 2 channels for load cell, 6 channels for LVDTs and
remaining 8 channels are free for additional input. The data
acquisition system converts the mechanical and electrical
signals in to the digital data. The output of signal is connected
to CPU via cord. The load and deformation values are stored at
desired intervals as note pad data. The direct shear software
develope
phs.
In this apparatus CNL and CNS boundary conditions are
reproduced by an electro hydraulic servo-valve which under the
control of an electronic controller controls the application of
hydraulic power to a linear
ce to the test specimen.
The thickness of the infill material (t) and height of asperity
(a) is maintained at 5mm for the present case. The normal
stiffness (k
n
) of surrounding ro
for CNS boundar
Figure 2 Close up
iva
The effect of shearing rate for different asperity joint under
different boundary conditions have been studied by Rao et al.
2009 and they found that the effect of increasing shear rate for
shearing rate > 0.5mm/min is to increase the peak shear stress
for the same initial normal stress and for shearing rate ≤ 0.5
mm/min, the effect of shearing rate is not much on the peak
shear stress. Hence, for the present case r
The shear behaviour of 15
0
-15
0
asperity unfilled and infill
joint under CNL (k
n
=0 kN/mm) and CNS (k
n
=8 kN/mm)
boundary condition is plotted as shown in Fig.3 and Fig.4
respectively. The stress – displacement behaviour is
characterized by a well defined peak. It is clear from the test
result that CNL boundary condition always under predicts the
shear strength of the joint as compared to CNS boundary
condition for the same initial normal stress. This is due to
increase in normal stress at the shearing surface during the
shearing because of restriction in dilation imposed by simulated
surrounding rock stiffness.
Shrivastava and Rao 2011 reported the variation of nomal
stress with shear displacement under CNL and CNS boundary
condition for similar type of synthetic rock joints. The normal
stress on the shear plane remains constant during testing for
CNL conditions. However, for CNS conditions normal stress
increases as asperity slides on over the other. Variation of
normal stress under CNS conditions exactly follows the shape
of the asperity, but angle of inclination is different.
The shear strength of the infill joint is less than that of unfill
joint for both CNS and CNL condition, when tested under the
same P
i
. But for CNS boundary conditions % decrease of shear
strength of infill joint is lower at higher P
i
. It may be due to
failure of infill material under increased compression.
The shear stress and displacement behaviour curve of
modelled rock joint can be divided into three zones. In the zone
I predominantly sliding of the sample take place without
shearing of the asperity. The limit of the zone-I depends upon
the shear strength of the material and shear stress increases at
higher rate with small shear displacement in this zone. In zone-
II, shearing of the asperity is more predominant than the sliding.
The limit of the zone-II is up to maximum shear stress, in this
zone rate of increase in shear stress decreases with shear
displacement. Zone-III is the last zone where all the asperity is
sheared off. Due to deposition of the crushed material on the
joints, shear stress decreases or increases slightly with shear
displacement depending upon CNL or CNS conditions.
Probable strength envelope is found by joining the peak
shear stress of different stress path and plotted as shown in
Fig.5.
Shear Displacement (mm)
0
5
10
15
20
25
Shear Stress (MPa)
0.0
0.5
1.0
1.5
2.0
2.5
3.0
CNL, P i =0.10
CNL, P i =0.31
CNL, P i =0.51
CNL, P i =1.02
CNL, P i =2.04
VNL, Pi=0.05
VNL, Pi=0.10
VNL, Pi=0.31
VNL, Pi=0.51
VNL, Pi=1.02
VNL, Pi=2.04
MPa
CNL, k n =0 kN/mm
VNL, k n =8 kN/mm
Figure 3. Shear behaviour of 15
0
-15
0
unfilled joint under CNL and CNS
boundary condition.
The shear test result on 15
0
- 15
0
asperity modelled rock joint
reflects that the strength envelope for both CNL and CNS
boundary condition is curvilinear and curvature is same up to
low P
i
i.e P
i
<0.09 σ
c
of the sample and after that the curvature
of the strength envelope is change. The change in the slope of
the strength envelop indicates that the complete shearing of the
asperity at that normal stress and sliding of samples takes place
after that normal stress. At low normal stress, shear strength
significantly increased because of the enhanced shearing
resistance offered by the angular asperities. However, at higher


