960
Proceedings of the 18
th
International Conference on Soil Mechanics and Geotechnical Engineering, Paris 2013
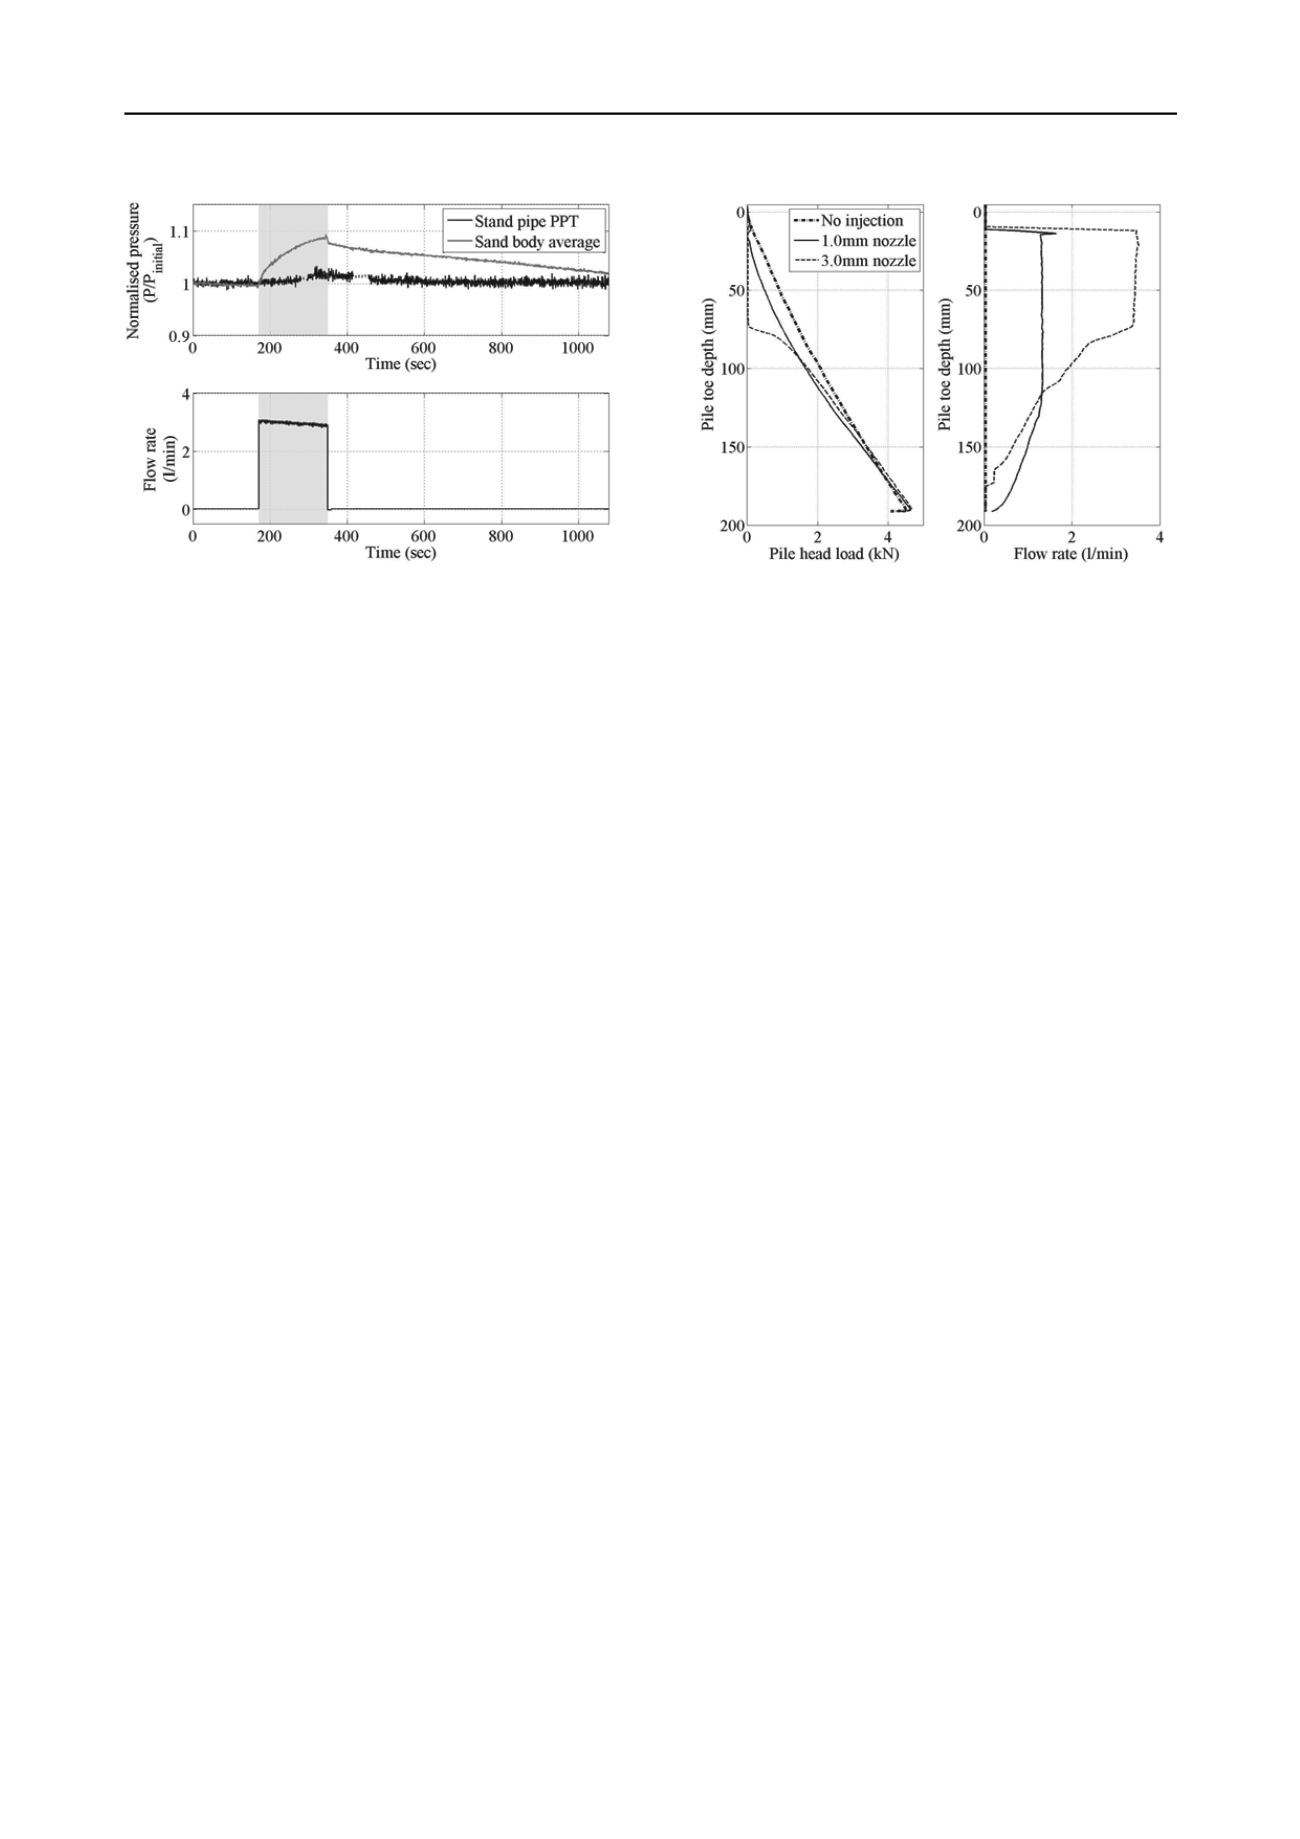
Figure 5. Illustration of a water injection event and subsequent model
drainage. Water is added to the model at around 3 litres per minute for
nearly 200 seconds (highlighted by the shaded region). This causes the
sand body to fill with water, represented by the increase in the
normalised pressure. Meanwhile, the stand pipe water level remains
constant and the pressure unchanged. (A dotted line represents a brief
period where the instrument failed.)
During an injection event, a small difference is evident in the
system. This is indicated by the increase in the sand body water
pressure during the injection phase. A small pressure difference
between the sand body and the standpipe arises, driving water
flow into the standpipe. Any additional water in the standpipe
drains away through the drainage holes at the top of the
standpipe.
The base pressure of the standpipe remains constant
throughout the process, showing that the standpipe maintains a
constant water height, as designed. With time, the pressure
difference between the standpipe and the sand body reduces.
This will slow the rate of drainage through the standpipe, until
the pressures become equal and no excess water is present in the
model after a time greater than 1100 seconds.
4.3 Installation load results
Multiple centrifuge tests were completed on identical sand
bodies. The sand bodies were tested for their continuity via a
control installation, without water injection. This was
effectively a penetration test and gave a reference to compare
the water injection aided installations to. There was good
agreement between the different control installations over the
multiple sand bodies used.
Figure 6 shows some installation data. The pile head loads
for three installations are shown – a control installation and two
water injection installations, one using a 1.0 mm diameter
nozzle and the other a 3.0 mm diameter nozzle. In addition, the
model flow rate is plotted, to show the link between the
delivered flow rate and reduction in load when compared to the
control installation.
Initially, load is generated in all installations as all piles are
installed to a depth of 2D
p
without the aid of water injection. At
this depth, the water supply to the pile is activated and the load
reduces to zero. The flow rate is allowed to stabilise at this
level as the pile installation continues.
The difference between the two nozzles is apparent, with the
smaller nozzle allowing a smaller peak flow rate to be pushed
through the pile. Despite a significant flow rate of 1.3 litres per
minute, there is little reduction in the pile load. The maximum
load reduction is experienced at the shallower depths, where the
load can be reduced to zero. Load reduction then diminishes
with depth as the pressure at the pile toe becomes closer to the
hydrostatic pressure in the sand body.
Figure 6. Comparison of effects of nozzles. Diameters 1.0 and 3.0 mm
nozzles are compared with the no injection installation. The flow rate
delivered to the pile is displayed for all installations in the right plot.
5 CONCLUSION
A water injection system has been successfully developed and
tested on the centrifuge at University of Cambridge. Peak
pressures of 1.2MPa and peak flow rates of 3.5 litres per minute
were delivered to the model pile. The system has been tested to
find the energy loss in the pipe line, with the aim of calculating
the toe pressure during an installation.
To maintain centrifuge balance during high flow rate events,
a standpipe system was developed and its performance closely
monitored. This proved successful for the duration of testing.
In addition, the system has been used to complete multiple
installations of water injection aided jacked piles. Different
nozzles were tested during the experimental program to
investigate their different effects. Whilst the effect of injection
reduces with depth, it was discovered that the larger nozzles
were the most effective at reducing installation loads.
6 ACKNOWLEDGEMENTS
The authors would like to thank Giken Seisakusho Ltd. for their
continued support throughout the duration of the research.
7 REFERENCES
Gaudin C., Bienen B. and Cassidy M.J., 2011. Investigation of the
potential of bottom water jetting to ease spudcan extraction in soft
clay.
Geotechnique
, 61(12) 1043-1054.
Goh T., Shiomi T., Yamamoto M., Ikeda T. and Motoyama M. 2004. A
solution for road construction. In
6th Malaysian road conference
,
Kuala Lumpur.
Goforth G.F., Townsend F.C. and Bloomquist D. 1991. Saturated and
unsaturated fluid flow in a centrifuge. In
Centrifuge in soil
mechanics
, 497-502, Ko and McLean.
Haigh S.K., Houghton N.E., Lam S.Y., Li Z. and Wallbridge P.J. 2010.
Development of a 2D servo-actuator for novel centrifuge
modelling. In
7th international conference on physical modelling
in geotechnics
, 239-244, Zurich.
Schneider J.A., Lehane B.M. and Gaudin C. 2008. Centrifuge
examination of pile jetting in sand. In
2nd IPA workshop
, 17-24
New Orleans.
Tomlinson M. and Woodward J. 2008.
Pile design and construction
.
Taylor & Francis, London
Tsinker G.P. 1988. Pile jetting.
Journal of geotechnical engineering
114(3), 326-334.
White D.J., Sidhu H.K., Finlay, T.C.R., Bolton M.D. and Nagayama T.
2000. The influence of plugging on driveability. In
8th
international conference of the deep foundations institute
, 299-310.
New York.


