1741
Technical Committee 204 /
Comité technique 204
ue of 16 mm/rev for
p
in the reference projects, the impact of
the penetration rate on the cutting distance
s
c
can be described
for the prognosis model by the impact factor
f
p
:
= 1 1,4
,
3
The number of scrapers per cutting track
k
sc
influences the
actual penetration rate
p
sc
of each scraper on the cutting track,
since the penetration rate
p
is shared between all scrapers on the
track depending on the angular distance between the scrapers.
Inversely to the penetration rate
p
, the impact of the number of
scrapers per cutting track on the cutting distance
s
c
can be de-
scribed for the prognosis model by the impact factor
f
k
:
= 1,4
4
For the impact of geotechnical parameters the analysis shows
that the correlation of individual parameters with the actual cut-
ting distance
s
c
does not lead to reasonable results. Therefore a
new index value considering the three main influencing factors
on abrasive wear was developed. These factors are:
•
Abrasivity of the soil components
•
Stress at the contact surface between soil and cutting tool
•
Shape parameters of the soil components
For the description of the abrasivity of the soil components
the Equivalent Quartz Content (
EQC
) in % was selected be-
cause of the wide applicability of the test on different soil types
and the high availability in the reference projects. The contact
stress
τ
act
[kN/m²] was approximated by the shear strength of the
soil in the excavation face
τ
c
using the M
OHR
-C
OULOMB
criteri-
on. As shape parameter for the soil components the grain size
D
60
in mm was selected, describing the size where 60% of all
grains in the soil are smaller than the given value.
The three parameters are weighted and combined in the new
Soil Abrasivity Index (
SAI
) (5). Theoretically the dimension of
the index is N/m, however the index should be regarded as di-
mensionless, because of its entirely empirical character.
SAI = EQC 100
∙ τ
∙ D
5
For the analysis of the correlation of the
SAI
with the actual
cutting distance
s
c
achieved by disc cutters in the reference pro-
jects the tip width
t
dc
of the disc cutters was standardized at 19.0
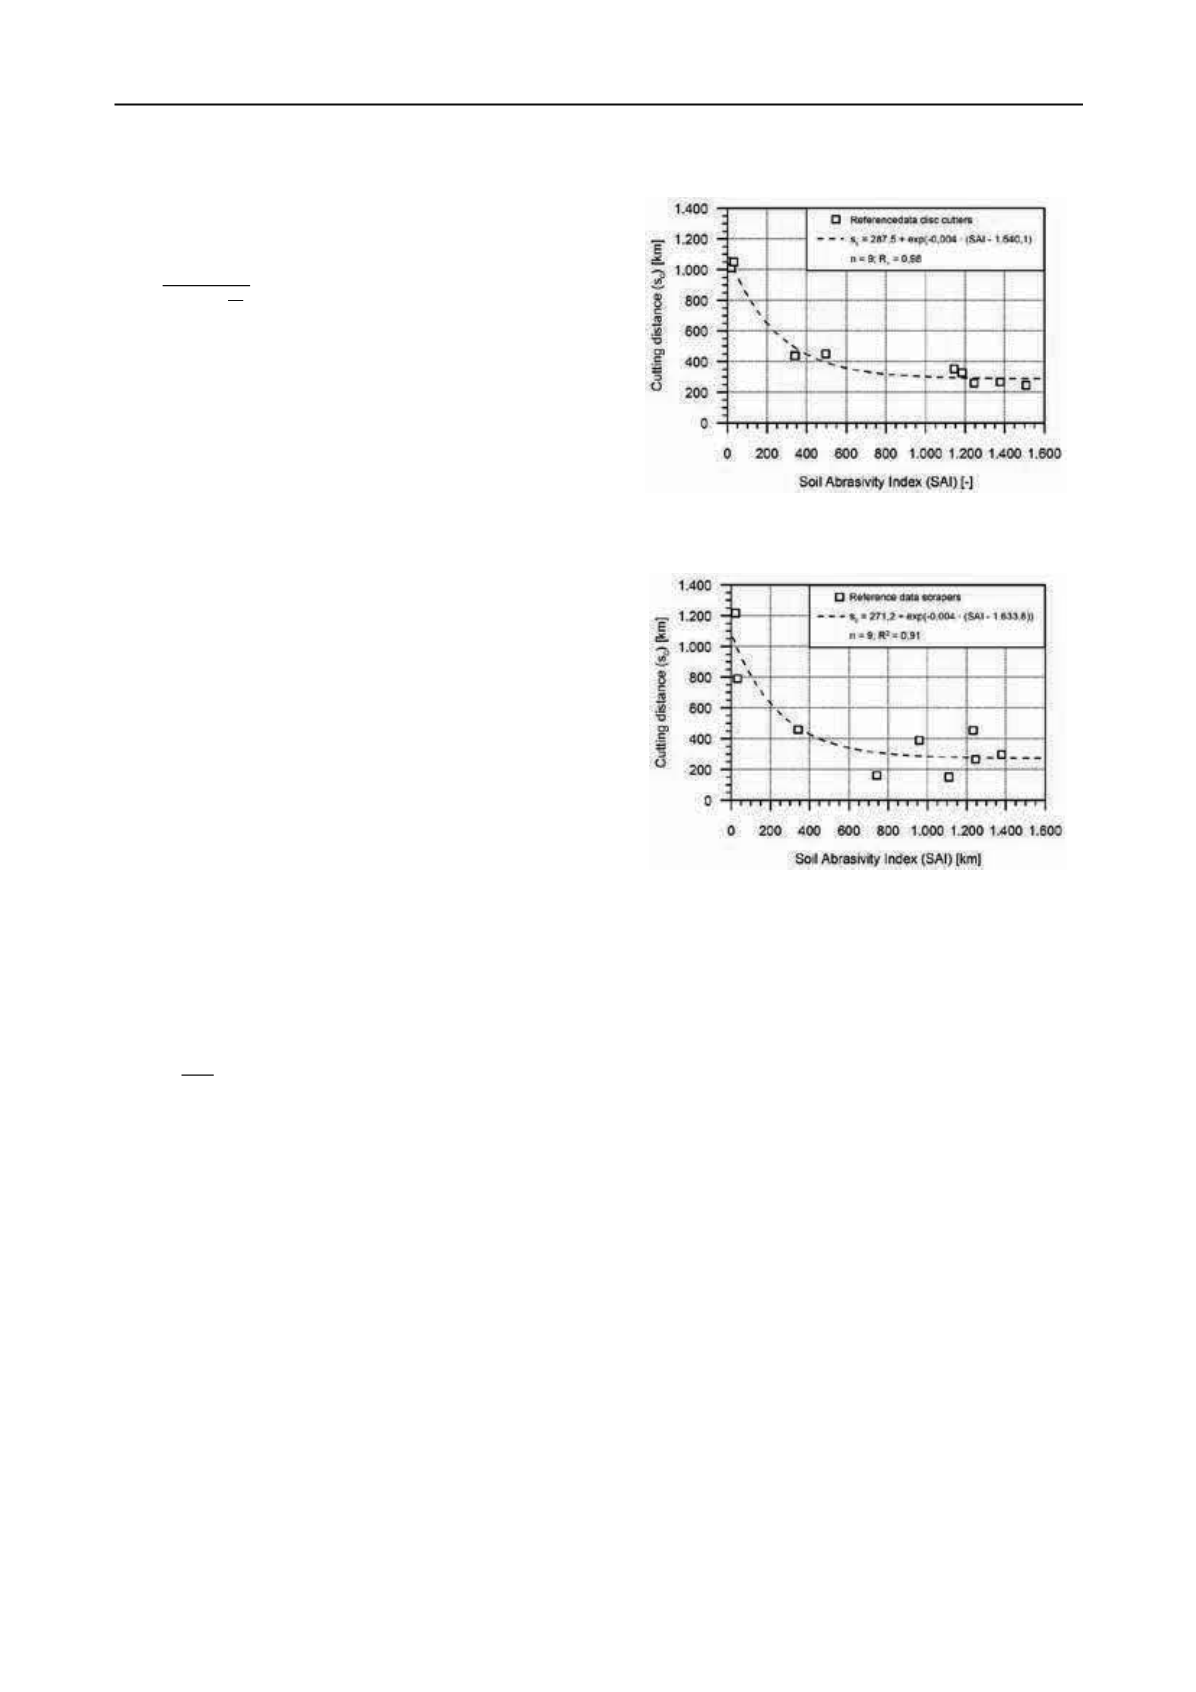
mm. The according correlation is shown in fig. 1.
For scrapers a very similar correlation between the
SAI
and
the actual cutting distance
s
c
was found. Here the number of
identical scrapers per cutting track and direction of rotation
k
sc
was standardized at 2.0. The according correlation is shown in
fig. 2.
For both tool types the analysis results in a significant expo-
nential correlation between the Soil Abrasivity Index and the
cutting distance
s
c
. This type of correlation reflects the generally
expected relation of soil abrasivity and tool life. An increase in
the Soil Abrasivity Index (
SAI
) leads to an according decrease
in the cutting distance
s
c
and vice versa. The correlations com-
ply with the finding that such correlations are in general contin-
uous and nonlinear (F
RENZEL
2010). A similar but weaker cor-
relation was found between NTNU soil abrasion tests and the
excavation volume
v
c
in m³ of cutting tools for EBP machines
(J
AKOBSEN
& D
AHL
2011).
3 PROGNOSIS MODEL
The results of the data analysis allow for the invers application
as an empirical prognosis model for the basic tool life. Based on
the tool life an engineering process for the estimation of the re-
sulting demand for hyperbaric interventions
I
and the intervals
b
I
between the interventions can be derived.
3.1
Basic tool life prognosis
The basic value for the cutting distance
s
cb
in km results from
the Soil Abrasivity Index
SAI
(5), entered in the correlations
given in fig. 1 and fig. 2 for disc cutters and scrapers. In addi-
tion the accuracy of the prognosis has to be considered. For a
conservative approach, a reduction of the value of
s
cb
derived
from the correlations in fig. 1 and fig. 2 by 40-50% is recom-
mended.
3.2
Correction of TBM design and advance parameters
The basic value for the cutting distance
s
cb
needs to be corrected
according to the actual TBM design and advance parameters.
The correction results in the expected value for the cutting dis-
tance
s
ce
in km for disc cutters (6) and scrapers (7).
=
∙
6
=
∙
∙
7
Figure 1. Correlation of the Soil Abrasivity Index (
SAI
) and the cutting
distance
s
c
of disc cutters in different geotechnical conditions.
Figure 2: Correlation of the Soil Abrasivity Index (SAI) and the
cutting distance
s
c
of scrapers in different geotechnical conditions.


