 
          1748
        
        
          Proceedings of the 18
        
        
          th
        
        
          International Conference on Soil Mechanics and Geotechnical Engineering, Paris 2013
        
        
          elastic, described by


            E


          r
        
        
          (Young’s modulus),


          r
        
        
          (Poisson’s ratio),
        
        
          and


          r
        
        
          (unit weight).
        
        
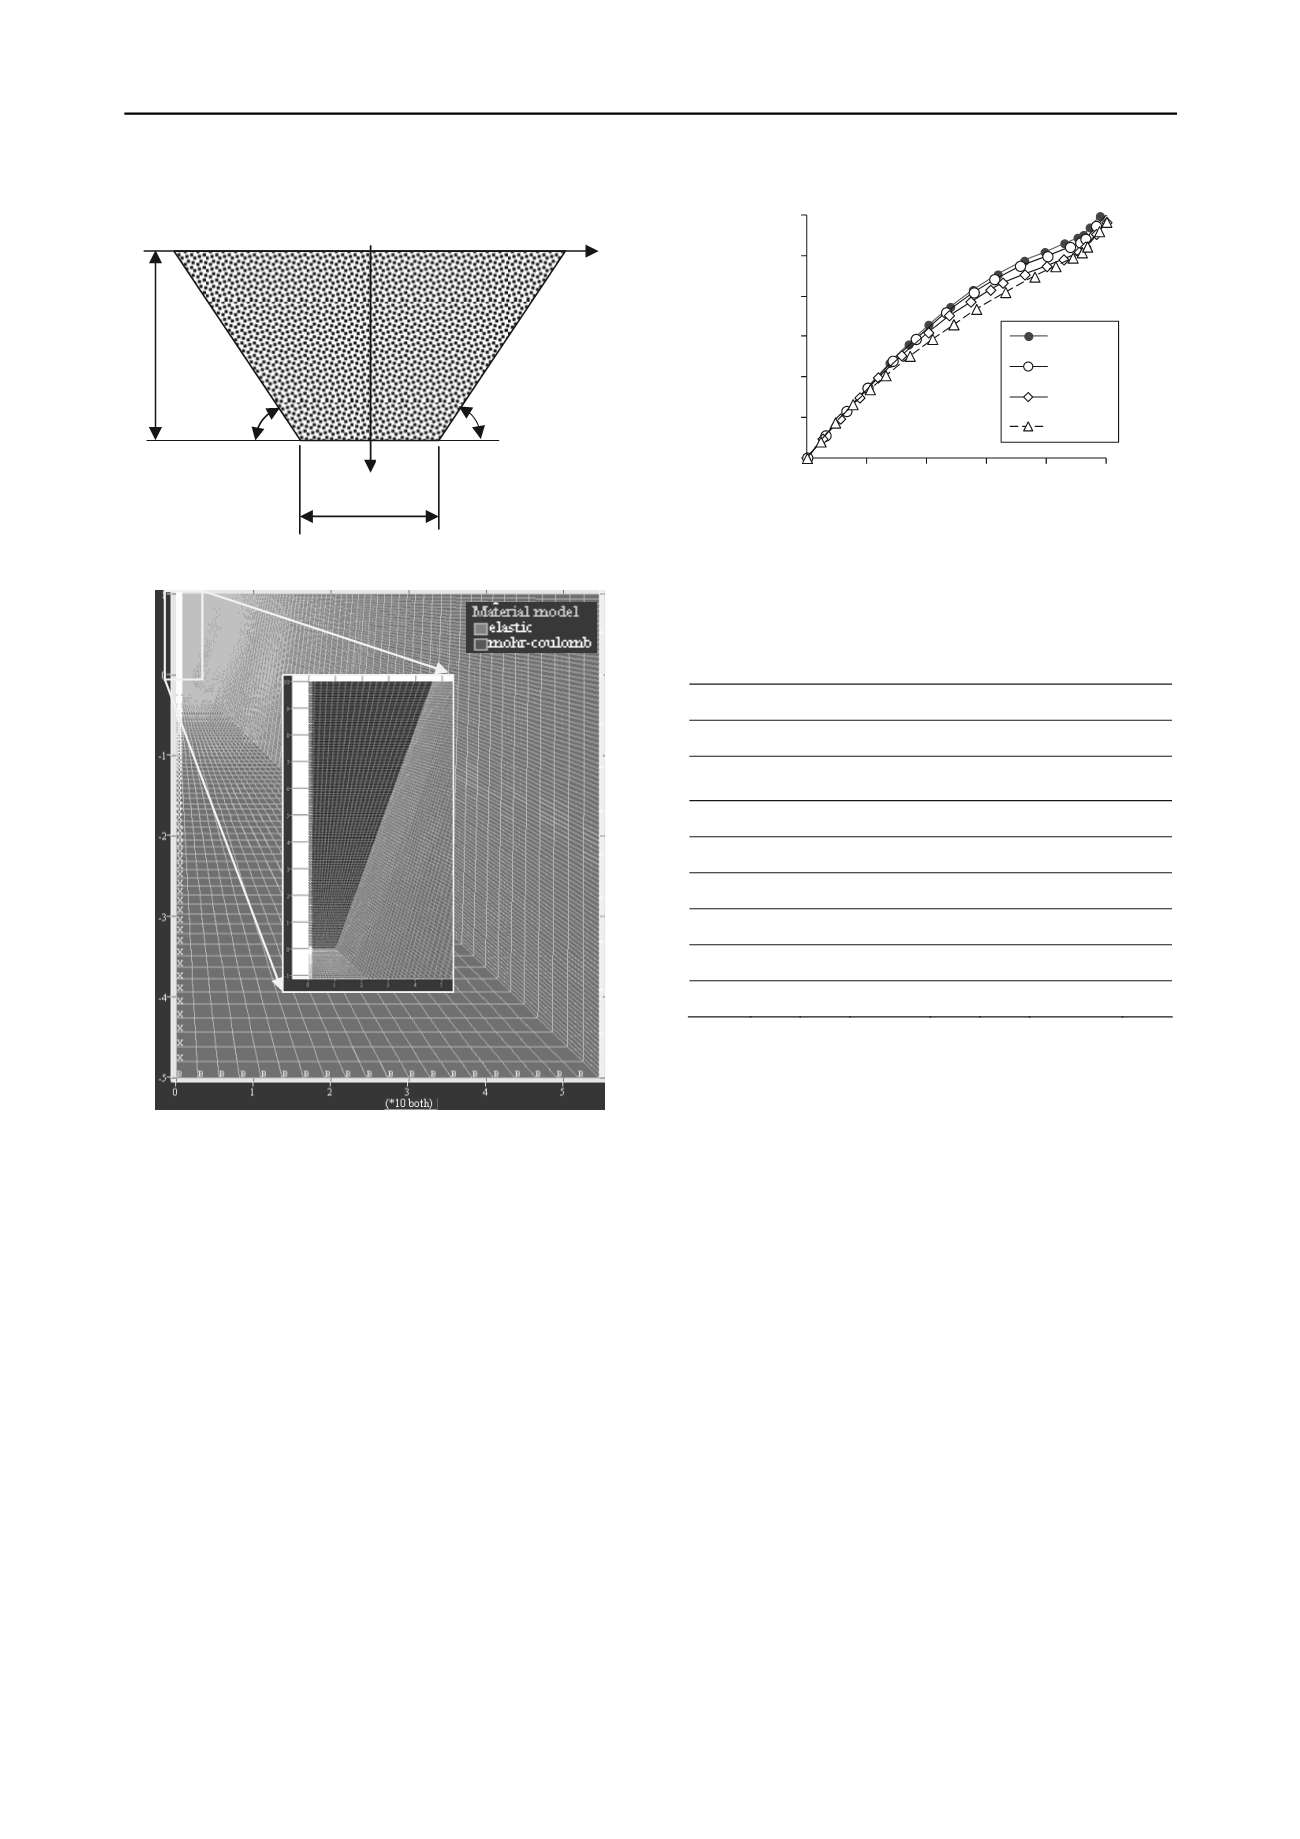
          Figure 1. Geometry of the backfilled trench with inclined walls.
        
        
          Figure 2. Model discretization of the trench with an enlarged view.
        
        
          Figure 2 shows a typical discretization used for numerical
        
        
          modeling with FLAC; symmetry is taken into account so that
        
        
          only half of the trench is considered. The numerical simulation
        
        
          is performed in steps, with the excavation of the trench being
        
        
          completed at first. The trench is then filled in layers, after initial
        
        
          walls displacements.
        
        
          Figure 3 shows the vertical stress distribution along the
        
        
          vertical central line (VCL) when the number of filling layers
        
        
          varies from 1 to 20 (to attain the full height


            H


          b
        
        
          ). It is noted that
        
        
          the stress magnitude increases slightly when the number of
        
        
          layers goes from 1 to 10. The stress is about the same for 10 or
        
        
          20 layers. In the following, all simulations are performed with
        
        
          10 layers of filling (i.e. 1 m / layer).
        
        
          Table 1 presents details of the numerical simulations
        
        
          conducted to investigate influencing factors related to the trench
        
        
          geometry and properties of the backfill, which may affect the
        
        
          vertical stress distribution along the VCL of inclined walls
        
        
          3 VERTICAL STRESS DISTRIBUTION
        
        
          In this section, the influence of the trench geometry, properties
        
        
          of the backfill, is assessed in term of the vertical stress
        
        
          distribution along the VCL.
        
        
          0
        
        
          20
        
        
          40
        
        
          60
        
        
          80
        
        
          100
        
        
          120
        
        
          0
        
        
          2
        
        
          4
        
        
          6
        
        
          8
        
        
          1


          v
        
        
          (kPa)


            h


          (m)


            x


          0
        
        
          20 layers
        
        
          10 layers
        
        
          5 layers
        
        
          1 layer


            H


          b


            h


            L


          b
        
        
          Figure 3. Vertical stress distribution along the vertical central line
        
        
          (VCL) of the trench with different filling layer number; details are given
        
        
          in Table 1.
        
        
          Table 1. Details of the numerical simulations conducted for
        
        
          investigating influence factors. Other properties include
        
        
          γ
        
        
          b
        
        
          =
        
        
          18 kN/m
        
        
          3
        
        
          for the backfill;


            E


          r
        
        
          = 30 GPa,


          r
        
        
          = 0.25, and


          r
        
        
          = 27 kN/m
        
        
          3
        
        
          for the linear
        
        
          lastic material forming the two walls.
        
        
          e
        
        
          Fig.


            L


          b


            c'


          b
        
        
          (kPa)


          '
        
        
          b


          '
        
        
          b


            E


          b
        
        
          (MPa)


          b
        
        
          3
        
        
          70° 2 m
        
        
          0
        
        
          30°
        
        
          0
        
        
          200
        
        
          0.2
        
        
          4
        
        
          †
        
        
          var
        
        
          ‡
        
        
          2 m
        
        
          0
        
        
          30°
        
        
          0
        
        
          200
        
        
          0.2
        
        
          5
        
        
          †
        
        
          70° var
        
        
          ‡
        
        
          0
        
        
          30°
        
        
          0
        
        
          200
        
        
          0.2
        
        
          6
        
        
          †
        
        
          70° 2 m
        
        
          var
        
        
          ‡
        
        
          30°
        
        
          0
        
        
          200
        
        
          0.2
        
        
          7
        
        
          †
        
        
          70° 2 m
        
        
          0
        
        
          var
        
        
          ‡
        
        
          0
        
        
          200
        
        
          0.2
        
        
          8
        
        
          †
        
        
          70° 2 m
        
        
          0
        
        
          30° var
        
        
          ‡
        
        
          200
        
        
          0.2
        
        
          9
        
        
          †
        
        
          70° 2 m
        
        
          0
        
        
          30°
        
        
          0
        
        
          var
        
        
          ‡
        
        
          0.2
        
        
          10
        
        
          †
        
        
          70° 2 m
        
        
          0
        
        
          30°
        
        
          0
        
        
          200
        
        
          var
        
        
          ‡
        
        
          †
        
        
          simulation performed with 10 layers of filling;
        
        
          ‡
        
        
          var = varying value.
        
        
          3.1


            Effect of trench geometry


          3.1.1


            Wall inclination


          Figure 4 shows the variation of the vertical stress distribution
        
        
          along the VCL with the wall inclination angle


          . One sees that
        
        
          the stress magnitude increases when the wall inclination angle


          decreases from 90° (vertical trench) to 20°. The vertical
        
        
          pressures obtained by the numerical modeling remain below the
        
        
          linear vertical stress distribution calculated from the overburden
        
        
          (i.e.


          v
        
        
          = γ
        
        
          b


            h


          ), indicating the occurrence of some arching effect.
        
        
          These results shown in Fig. 4 are not unexpected. Keeping
        
        
          the width at the base of the trench (


            L


          b
        
        
          ) constant, a decrease in
        
        
          the wall inclination angle (


          ) leads to an increase of the trench
        
        
          width in the upper part. This tends to decrease the arching effect
        
        
          and leads to an increase in the vertical stresses in the backfill.
        
        
          These results also indicate that the direct application of Marston
        
        
          (1930) solution to a trench with inclined walls would tend to
        
        
          underestimate the loads on the conduits, leading to non
        
        
          conservative design (Li et al. 2012a,b).
        
        
          All other calculations are performed with


          = 70°.
        
        
          3.1.2


            Trench width


          Figure 5 presents the vertical stress distributions obtained from
        
        
          the simulations along the VCL for different width at the base of
        
        
          the trench (


            L


          b
        
        
          ). Without any surprise, it is seen that an increase
        
        
          of width


            L


          b
        
        
          leads to a significant increase in the vertical stresses
        
        
          in the backfill.