1752
Proceedings of the 18
th
International Conference on Soil Mechanics and Geotechnical Engineering, Paris 2013
information system-Artificial Neural Network (GIS–ANN)
approach can be used effectively as a decision support tool for
making tunneling performance predictions that are required in
routine tunnel design works. Boubou et al. (2010) analyzed
ground movements induced by tunnelling and their correlation
with TBM operation parameters using a nonlinear least square
approximation and an ANN. Measured ground movements are
reproduced with reasonable agreement by each of the two
approaches. Lui et al. (2011) proposed a predictive control
strategy for earth pressure balance during excavation, where an
earth pressure prediction model taking advance speed and screw
conveyor speed as the control parameters is established by
means of least squares support vector machine (LS-SVM). The
simulation results demonstrate that their method is very
effective to control earth pressure balance. Jiang et al. (2011)
presented an integrated optimisation method for the feedback
control of tunnel displacement which combines the SVM,
particle swarm optimisation (PSO) and numerical analysis
methods. Lü et al. (2012) proposed an efficient approach for
probabilistic ground-support interaction analysis of deep rock
excavation using the ANN and uniform design. Mahdevari and
Torabi (2012) developed a method based on ANN for prediction
of convergence in tunnels. Darabi et al. (2012) preformed tunnel
stability analysis and subsidence prediction using empirical,
numerical, neural network and statistical methods.
Mohamadnejad et al. (2012) used three approaches to predict
the vibrations in excavations. The vibrations were predicted
using several widely used empirical methods and two
intelligence science techniques namely general regression
neural network (GRNN) and SVM. They conclude that the
SVM technique is more precise than the other used methods.
Pourtaghi and Lotfollahi-Yaghin (2012) presented an alternative
method of maximum ground surface settlement prediction
caused by tunnelling, which is based on integration between
wavelet theory and ANN, or wavelet network (wavenet). The
simulation results indicate excellent learning ability compared
to the conventional back-propagation neural network with
sigmoid or other activation functions. Mahdevari et al. (2012)
employed well-known Artificial Intelligence based methods,
SVM and ANN, to predict the ground condition of a tunneling
project. They concluded that the performance of the SVM
model is better than the ANN model and a high conformity was
observed between predicted and measured convergence for the
SVM model.
3 ARTIFICIAL NEURAL NETWORKS AND SUPPORT
VECTOR MACHINES
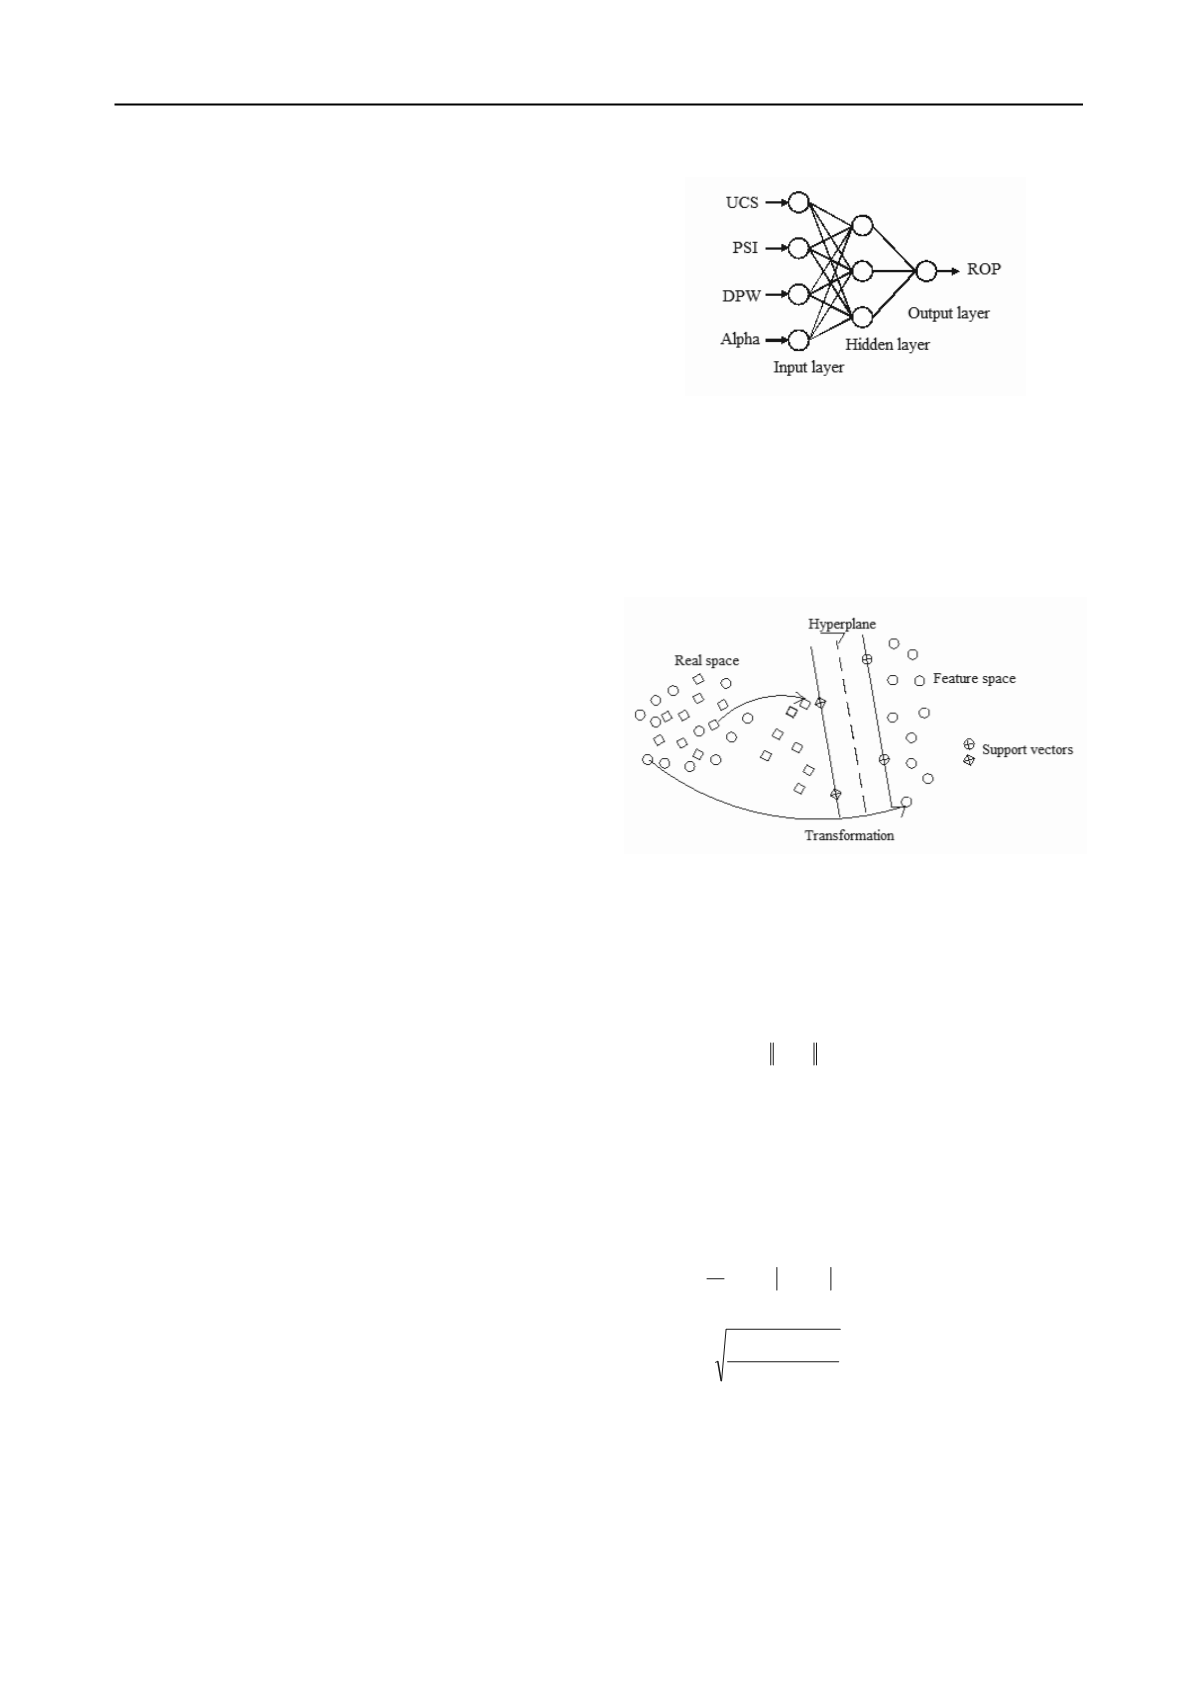
Artificial Neural Networks are intended to be an approximation
to the architecture of the human brain. These networks consist
of processing units (nodes) interconnected according to a given
configuration. The multi-layer perceptron (Figure 1) is the most
popular configuration (Haykin 1999).
The nodes are constituted by: a set of connections (w
ij
), each
one labeled by a weight, which has an excitatory effect for
positive values and inhibitory effect for negative ones; an
integrator (g), which reduces the n input arguments (stimuli) to
a single value; and an activation function (f) which can
condition the output signal, by introducing a component of non-
linearity in the computational process.
In the present paper the network weights are initially
randomly generated within the range [-0.7, +0.7] and it is used
the logistics activation function (1 / (1 + exp (-x)). Then, the
training algorithm is applied adjusting successively the weights,
stopping when the slope of the error is approximately zero or
after a maximum number of iterations. The prediction is made
by adding the contribution of all connections activated.
Figure 1. Example of a multilayer perceptron.
The SVM (Cortes and Vapnik 1995) were originally
designed for classification problems based on the separation of
two classes of objects using a set of functions known as kernels
(Figure 2). In this process, called mapping, the classes are
separated by hyperplanes being used one iterative optimization
algorithm to find the hyperplane that provides the largest
separation between the classes. This separation is related to a set
of support vectors in the feature space.
Figure 2. Example of the SVM transformation.
Both in classification and regression methods there is an
error function to minimize subjected to some constraints. In this
paper it will be used the popular Kernel with Radial Basis
which presents less hyperparameters and smaller numerical
difficulties than other kernels (eg, polynomial or sigmoid)
Cortez 2010):
0 ,
exp ) ,(
2
y x
yxk
(1)
In addition to the parameter of the kernel, γ, two more
parameters are used: the penalty parameter, C, and ε, the width
of the ε-insensitive zone.
The performance of models was assessed using the Mean
Absolute Deviation (MAD, Equation 2), the Root Mean
Squared Error (RMSE, Equation 3) and the Pearson’s product-
moment correlation coefficient (R).
N
i
i
i
y y
N
MAD
1
1
(2)
N
y y
RMSE
N
i
i
i
1
2
(3)
where N denotes the number of examples, y
i
the desired value
and ŷ
i
the estimated value by the considered model.
4 DATABASE AND PREVIOUS EQUATIONS FOR ROP
The database used in this study was presented by Yagiz (2008)
and is composed of 153 data sets collected from 151 different
locations from a tunnel excavated in fractured igneous and
metamorphic rock in New York City. The independent variables


