1722
Proceedings of the 18
th
International Conference on Soil Mechanics and Geotechnical Engineering, Paris 2013
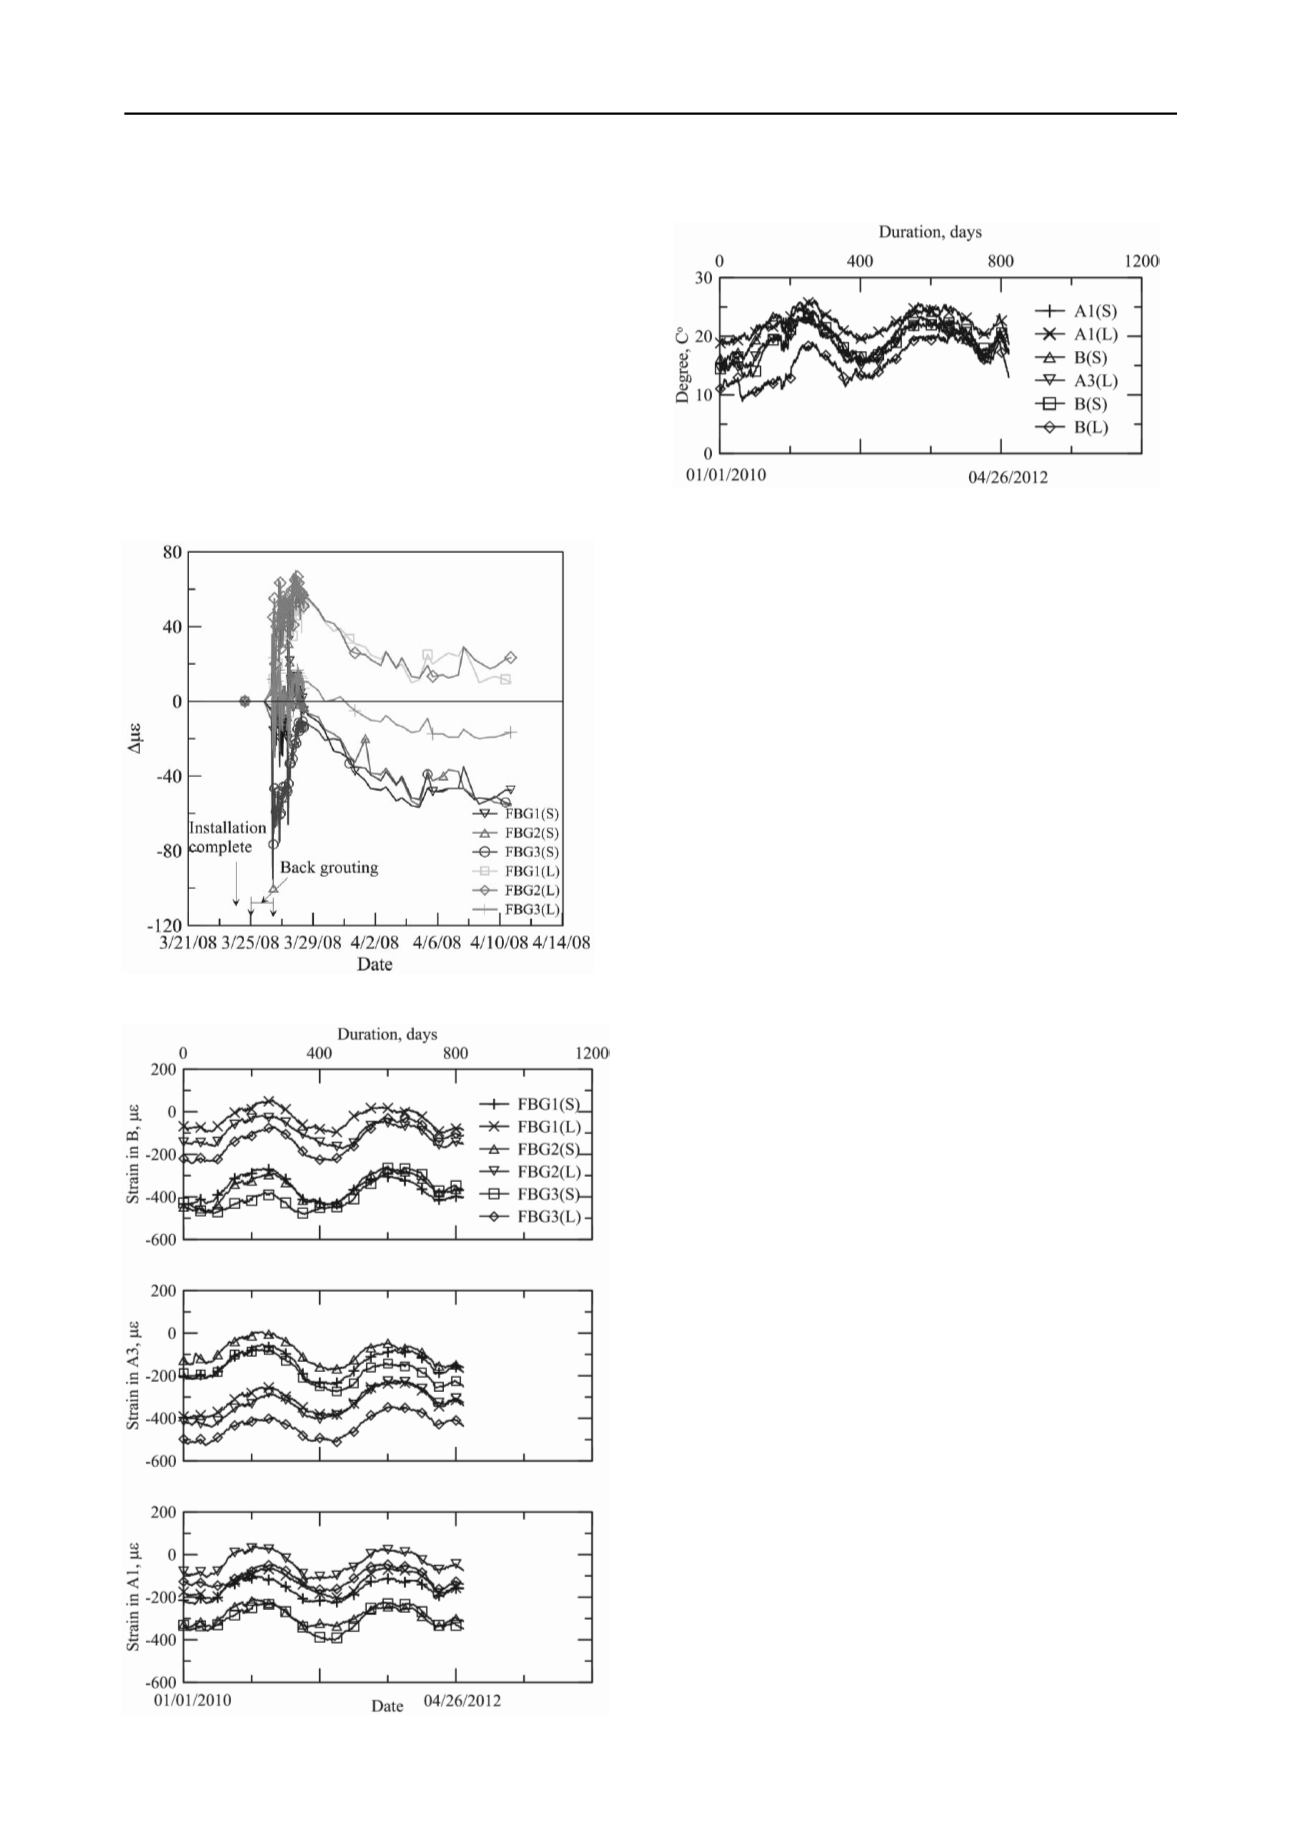
among the three panels. A comparison with the temperature record as
depicted in Figure 12 indicates that the strains registered in the panels
appear to be synchronized with that of temperature. As the tunnel near
its completion and temperature stabilizes, the strain fluctuation also
reduces.
4 CONCLUDING REMARKS
Essentially all FBG sensors installed in this case are still
functioning, nearly five years after construction. The experience
shows that because FBG is immune to EMI and made of
durable material, FBG can be an ideal sensor to provide
reference data for future tunnel lining design, as a means for
construction quality assurance and for long term safety
monitoring against nearby construction activities.
Figure 12. Long term temperature readings.
5 REFERENCES
Mohamad, H., Bennett, P.J., Soga, K., Mair, R.J., Lim, C.S., Knight-
Hassell, C.K., and Ow, C.N., 2007. Monitoring tunnel deformation
induced by close-proximity bored tunneling using distributed
optical fiber strain measurements. Proc. Seventh International
Symposium on Field Measurements in Geomechanics, Boston.
Kersey, A.D., 1992. Multiplexed Fiber Optic Sensors.” Fiber Optic
Sensors, Proceedings of SPIE, Vol. CR44, pp.200-225.
Figure 10. Change of strains in the early stage of A1 panel
installation.
Figure 11. Long term strain readings.


