1717
Technical Committee 204 /
Comité technique 204
of soil at the base of tunnel, which is different from the original
response displacement method. Finally, the seismic response of
the immersed tunnel is obtained by exerting the seismic
acceleration on the tunnel through interaction springs and
dashpots. The specific mathematical expression of the physical
model in the time domain is
b t
t
ts
t
ts
t
t
uM u K u C uM
(10)
where
M
t
= lumped mass of the tunnel particle;
C
ts
= damping
coefficient of the system shown in Fig. 4; and
K
ts
= stiffness
coefficient which is constituted of
K
t
and
K
1
.
In the frequency domain, Eq. (10) will become
t
s
t
ts
t
t
UC i
Ki
UK UM
1
2
2
b t
UM
2
(11)
where
U
t
(
ω
)
= Fourier amplitude of displacement of the tunnel
structure;
K
1
= frequency-dependent dynamic stiffness; and
C
s
=
frequency-dependent radiation damping coefficient of the soil.
Immersion joint
Segment
Particle
Figure 4. Simplified model of the immersed tunnel structure for modified
response displacement method
6 DYNAMIC SPRING STIFFNESS AND RADIATION
DAMPING COEFFICIENT
The stiffness of interaction springs is regarded as a static
stiffness independant of the external excitation frequency in the
response displacement method. Actually, the spring stiffness is
related to the seismic excitation frequency, which have been
considered in the modified response displacement method. The
dynamic stiffness of interaction springs can be defined as
0
1
k k k
stat
(12)
where
k
1
= dynamic spring stiffness shown in Fig. 2;
k
stat
=
static spring stiffness; and
k
0
(
ω
) = dyanmic stiffness coefficient.
Similar to the dynamic impendance of embedded foundations
proposed by Gerolymos & Gazetas (2006), the dynamic
stiffness coefficient
k
0
(
ω
) and radiation damping can be
approximately expressed as
2
0
0
0
0074 .0 08.0
1
a
B
D
B
Da
k
(13)
14.0
0442 .0
0416 .0 31.0
0
B
D
a
B
D
ws s
sur b s
s
Av
cAv C
(14)
where
D
and
B
= the height and width of the tunnel cross
section, respectively;
a
0
=
wB/
2
v
s
= dimensionless frequency; and
v
s
= shear wave velocity of the soil;
ρ
= soil density;
A
b
= base
area of the tunnel;
A
ws
= the sum of sidewall areas parallel to
loading; and
c
sur
(
ω
)
= radiation damping of surface foundations.
7 SEISMIC RESPONSE ANALYSIS OF HZM TUNNEL
The modified response displacement method is used to analyze
the seismic response of the HZM immersed tunnel. Moreover,
the calculation results by the modified response displacement
method are compared with that by the response displacement
method.
The soil along the longitudinal direction of the HZM immersed
tunnel is simplified into one particle every 22.5m, which means
that there are 253 soil particles altogether. The computational
model containing the whole immersed tunnel is set up in this
paper in terms of the multi mass-spring model shown in Fig. 2.
Analysis results in seven different positions along the
longitudinal direction of the tunnel location are given in this
paper (Fig. 5), and the other results are not presented
considering the limited space. Time history and frequency
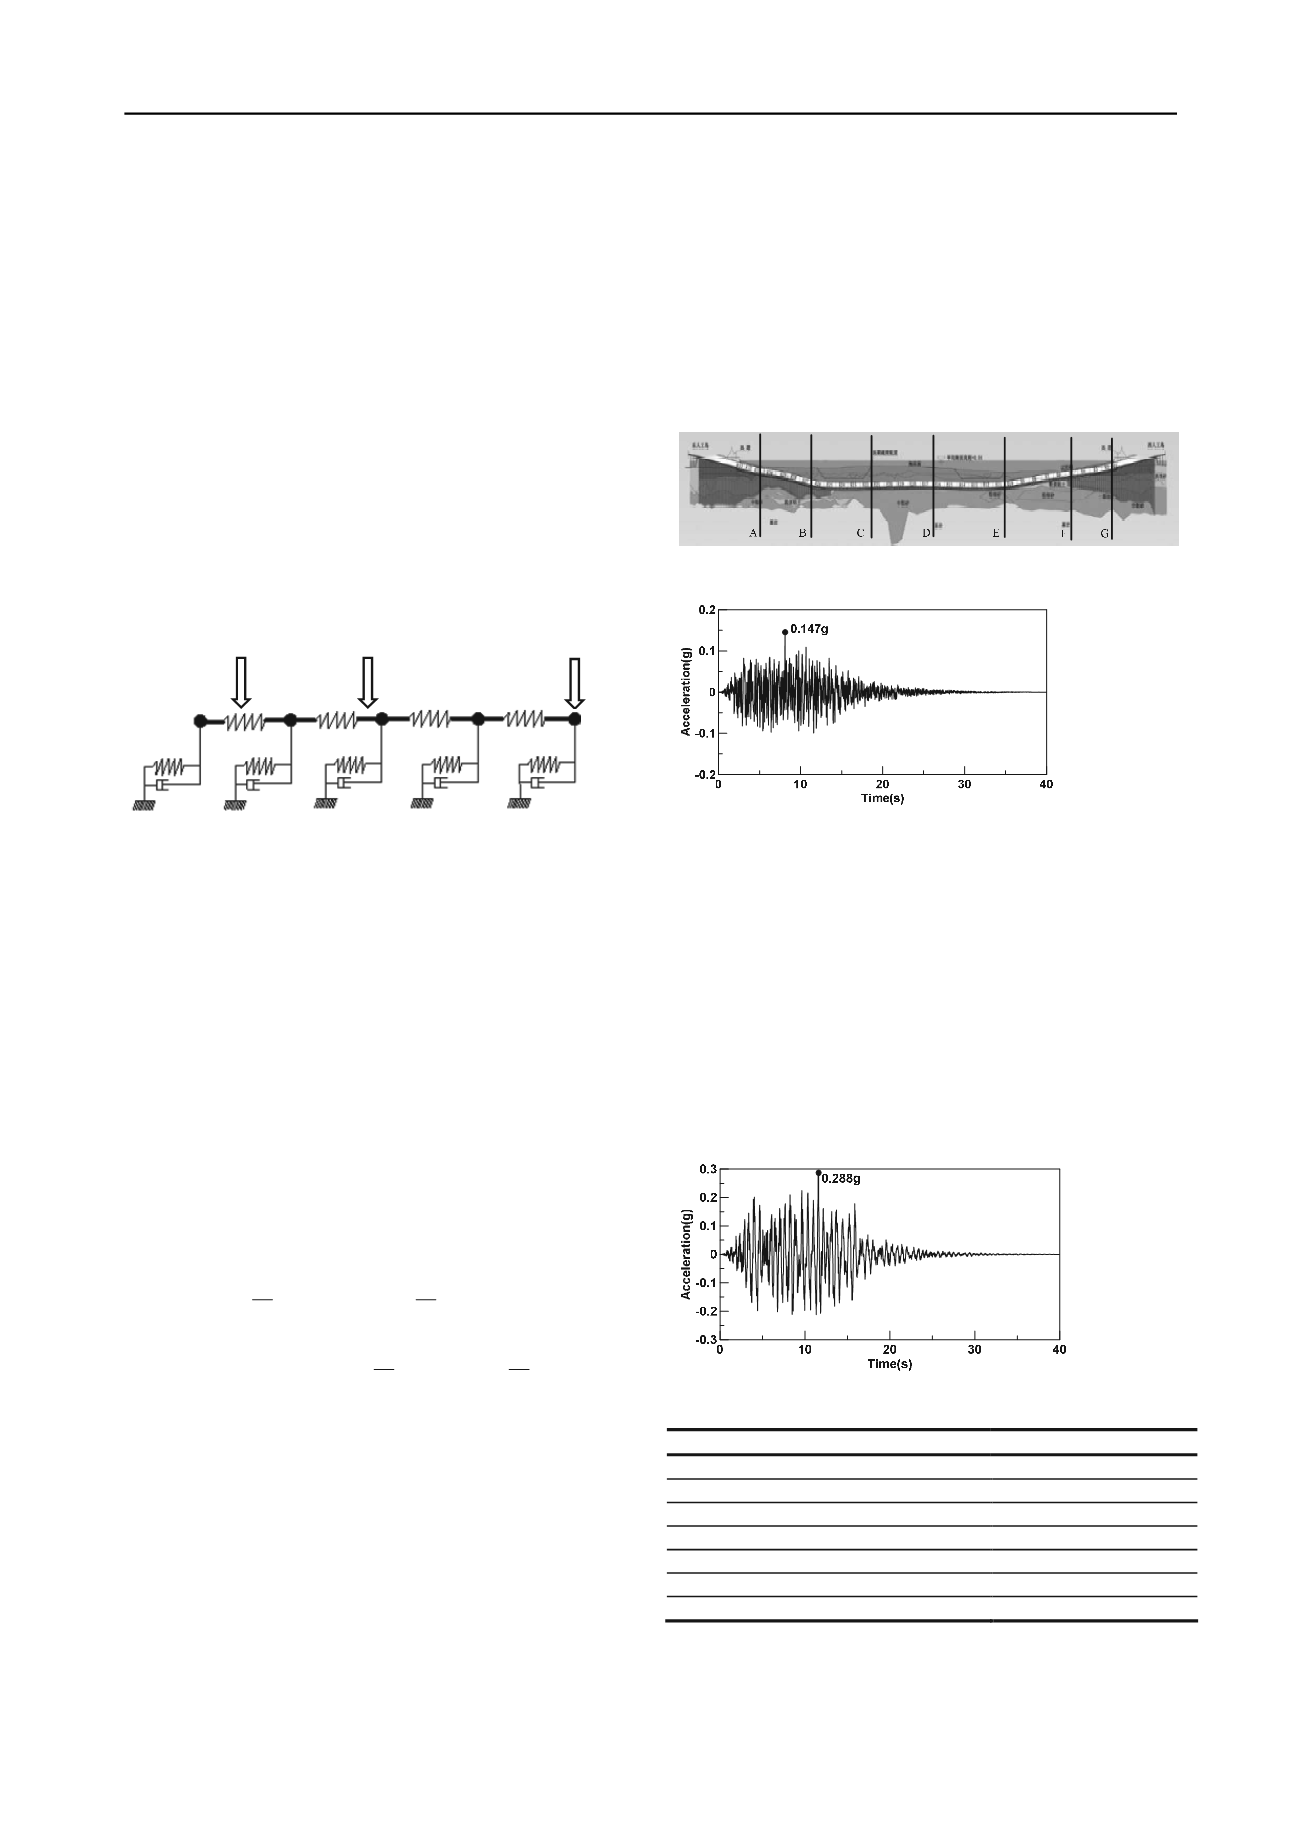
spectrum of the input seismic acceleration are shown in Fig. 6.
Figure 5. Profile of the HZM immersed tunnel
Figure 6. Time history of input seismic acceleration
8 DYNAMIC ANALYSIS RESULTS - SOIL
AMPLIFICATION
Due to space limitation, only the time history of seismic
acceleration at location A is given in this paper, which is shown
in Fig. 7. Peak accelerations of seven different positions are
illustrated in Table 1. It can be readily seen that seismic
acceleration of the soil is apparently amplified compared with
the peak acceleration 0.147g of input seismic motion. The
reason of this is that natural vibration frequency of the site soil
is relatively low, and the input seismic acceleration is also
characterized by the low frequency contents.
Figure 7. Time history of seismic acceleration at location A
Table 1: Peak acceleration in different positions
Location
Peak acceleration/g
A
0.288
B
0.28
C
0.241
D
0.275
E
0.322
F
0.283
G
0.255


