 
          1713
        
        
          Technical Committee 204 /


            Comité technique 204


          0
        
        
          20
        
        
          40
        
        
          60
        
        
          80


          (MPa)
        
        
          0
        
        
          100
        
        
          200
        
        
          300


          (MPa)


          =0.0


          =0.3


          =0.5


          =1.0


          =0.1


          =0.8
        
        
          Peak strength
        
        
          Residual strength


          =0.2


          =0.4


          =0.6


          =0.7


          =0.9
        
        
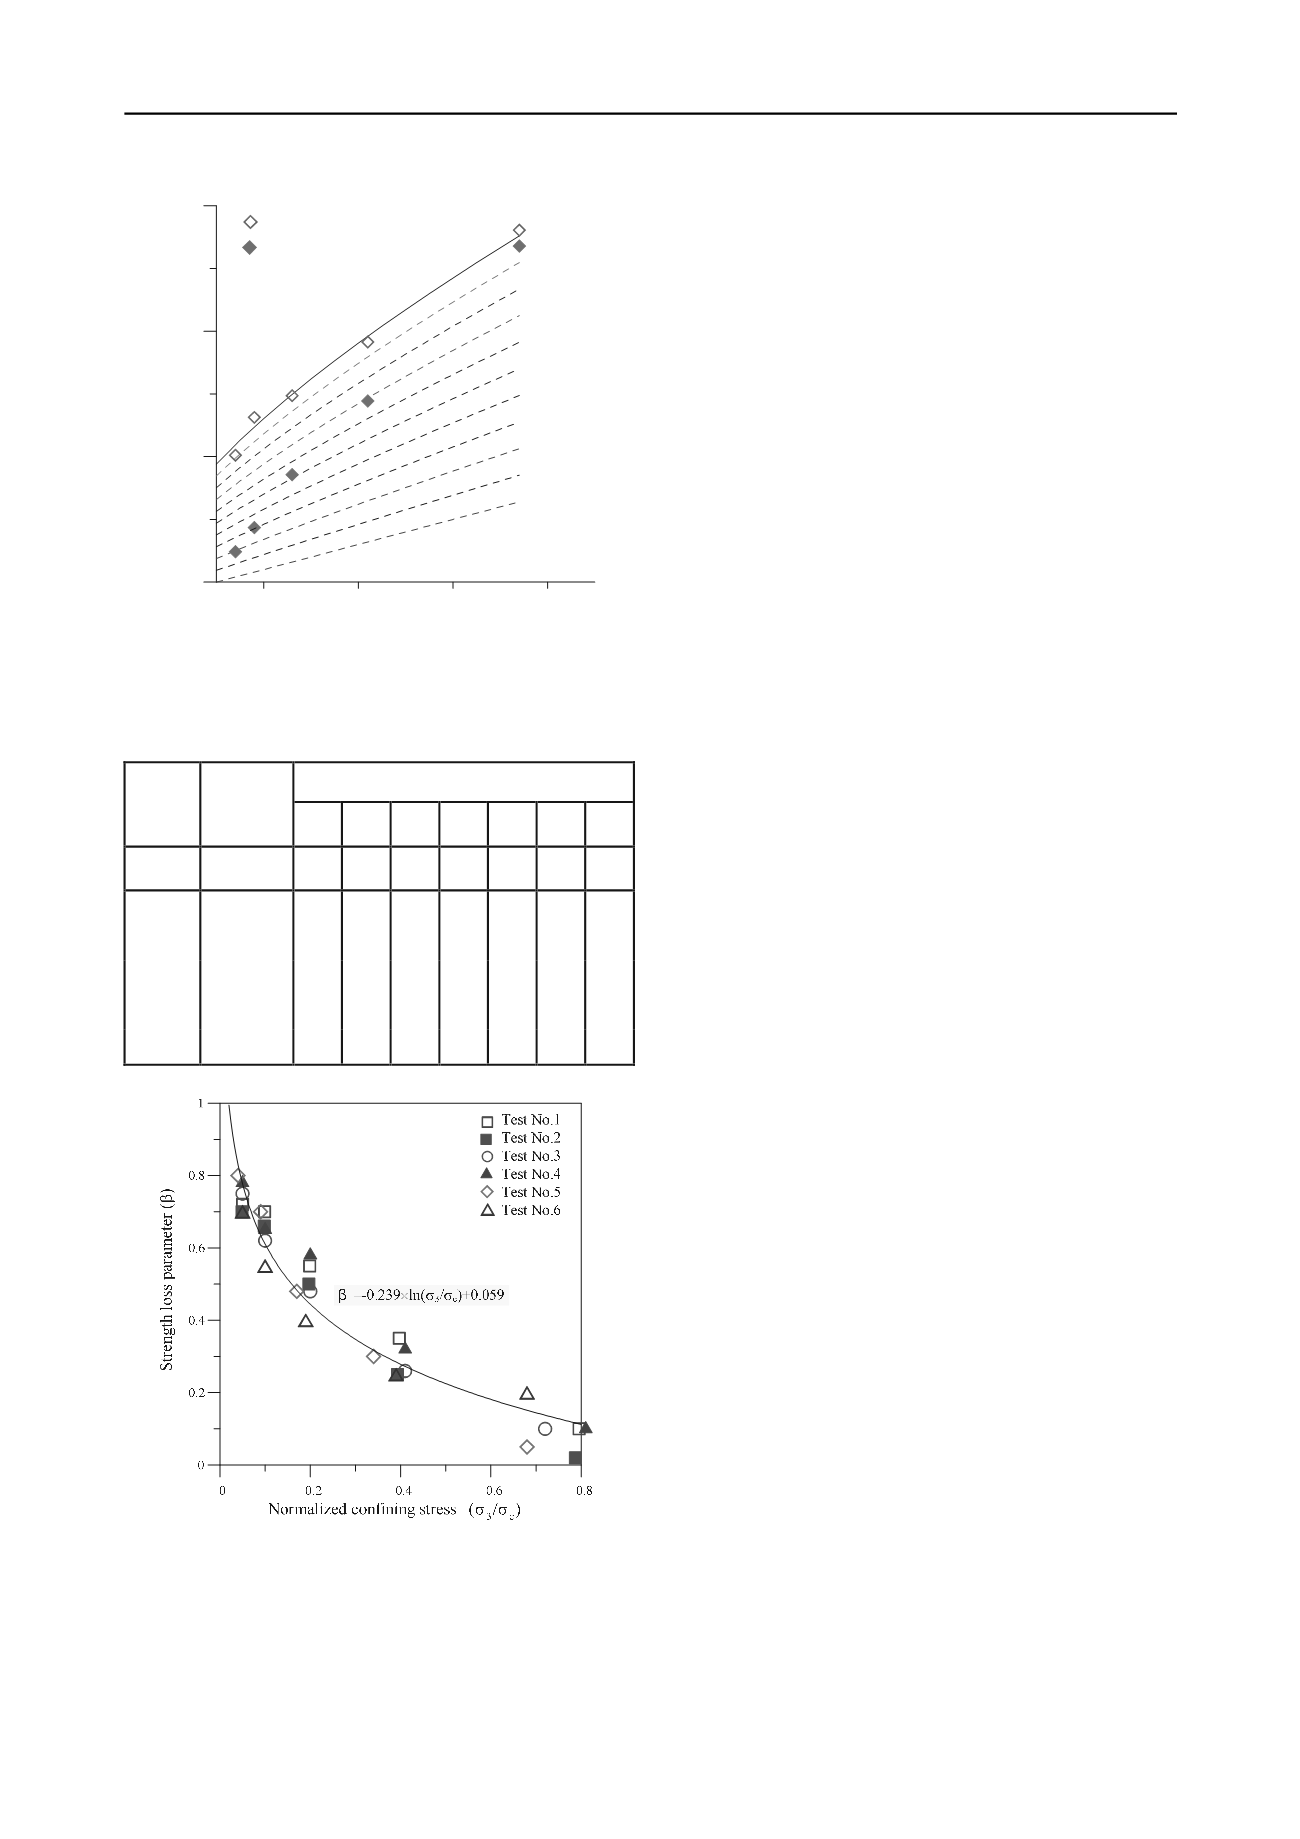
          Figure 3. Schematic evaluation of the stress loss parameter by using the
        
        
          post-peak form of the Hoek-Brown failure for the Test No.1
        
        
          marble specimen
        
        
          Table 2. Results of post-peak strength estimation for the Test No.1
        
        
          marble specimen (stress unit: MPa)
        
        
          Mechanical parameters
        
        
          Confining
        
        
          stress
        
        
          (


          3
        
        
          )


          c


            R


            c


            b


            m


            R


            b


            m


          s


            a


          Peak
        
        
          -
        
        
          0 94
        
        
          -
        
        
          6.0
        
        
          -
        
        
          1.0 0.5
        
        
          64
        
        
          0.05
        
        
          89
        
        
          5.7 1.0 0.5
        
        
          32
        
        
          0.30
        
        
          66
        
        
          4.2 1.0 0.5
        
        
          Post-peak
        
        
          16
        
        
          0.48
        
        
          -
        
        
          49
        
        
          -
        
        
          3.1 1.0 0.5
        
        
          8
        
        
          0.70
        
        
          28
        
        
          1.8 1.0 0.5
        
        
          4
        
        
          0.80
        
        
          19
        
        
          1.2 1.0 0.5
        
        
          Figure 4. Correlation between strength loss parameter and normalized
        
        
          confining stress on marble
        
        
          Furthermore, the relationship between the strength loss
        
        
          parameter and the normalized confining stress (divided by
        
        
          uniaxial compressive stress) for the tests showed in Table 1 was
        
        
          sketched (see Figure 4). From the figure, the strength loss
        
        
          parameter is progressively increased with the decreasing of the
        
        
          confining stress and the regression equation can be obtained as


          059 .0 /
        
        
          ln 239 .0
        
        
          3


            c


          (5)
        
        
          4 CASE STUDY
        
        
          The effect of post-peak strength degradation on deep
        
        
          underground excavation was examined by a modeling of a road
        
        
          tunnel. The tunnel is part of the project providing a safe and
        
        
          reliable connecting highway for east and north Taiwan. The
        
        
          case tunnel is a twin-hole tunnel with excavation span of 12.5 m.
        
        
          The pillar width between two tunnels is about 30 m. According
        
        
          to the geotechnical survey report (Sinotech 2011), the main rock
        
        
          type along the tunnel is marble, which average uniaxial
        
        
          compressive strength is around 80 MPa. The strength
        
        
          parameters of rock mass in good quality range (GSI=80) was
        
        
          estimated by using the method suggested by Hoek (2002). The
        
        
          estimation results of peak strength are listed in Table 3.
        
        
          Furthermore, Equation 2, 3 and 5 was adopted to estimate the
        
        
          post-peak strength under various confining stresses. The
        
        
          computer program FLAC was used to simulate the tunnel
        
        
          construction. A subroutine of FISH language embedded within
        
        
          FLAC was developed to input the parameters of post-peak
        
        
          strength depending on the value of confining stress as the
        
        
          element is yielding during period of calculation.
        
        
          The top heading method is designed for the tunnel
        
        
          excavation and the cycle length is 3.5 m for good rock mass
        
        
          (GSI=80). The support works used including 8 cm thick steel
        
        
          fiber reinforced shotcrete with systematic rock bolts. The rock
        
        
          bolts installed are of 25 mm


          with length of 4 m and spaced of
        
        
          2.0m
        
        
          ×
        
        
          3.0~4.0m. The allowable tunnel deformation is 5 cm in
        
        
          the support system. Two different overburden depths of 500 m
        
        
          and 1000 m were considered in the case study. Vertical stress
        
        
          (P
        
        
          0
        
        
          ) was calculated by dead weight of rock mass as P
        
        
          0
        
        
          =


          H,
        
        
          where


          is the unit weight of rock mass and H is the overburden
        
        
          depth. The horizontal stress was estimated with references to the
        
        
          results of in-situ overcoring test in the eastern Taiwan (Hsiao et
        
        
          al. 2006). The maximum horizontal stress is 1.2 times of
        
        
          vertical stress.
        
        
          The Hoek-Brown model (no strength degradation, HB model)
        
        
          and the post-peak strength degradation model (SD model) were
        
        
          adopted to analyze the tunnel excavation behavior. The results
        
        
          of the analyses are displayed in Table 4. When the overburden
        
        
          depth is 500 m with the Hoek-Brown model, the roof settlement
        
        
          of tunnel is 1.7 cm, the horizontal convergence of bench is 1.9
        
        
          cm and both the relaxation zone thickness at the roof and the
        
        
          sidewall are 0.5 m. Then the tunnel deformation would increase
        
        
          apparently where the overburden reaches to 1000 m, that is, 3.8
        
        
          cm in the roof settlement and 4.2 cm in the horizontal
        
        
          convergence. And the relaxation zone thickness surrounding the
        
        
          tunnel would increase to 1.5 m as well. However, the tunnel
        
        
          deformation is still under the designed allowable value of 5 cm
        
        
          even the tunnel depth reaches to 1000 m.
        
        
          In case the post-peak strength degradation is considered, the
        
        
          roof settlement of 3.7 cm and the horizontal convergence of
        
        
          bench of 4.4 cm are obtained at the tunnel depth of 500 m in the
        
        
          SD model. And approximate 2.6 times of deformation increased
        
        
          would occur when the tunnel depth reaches to 1000 m, that is,
        
        
          9.8 cm in roof settlement and 9.0 cm in horizontal convergence.
        
        
          The tunnel deformation obviously exceeds the designed
        
        
          allowable value and tunnel may need re-mining in deep
        
        
          overburden condition, as shown in Figure 5.
        
        
          The above analyses demonstrate that the characteristic of
        
        
          post-peak strength degradation may affect the tunnel behavior.
        
        
          The effect intensity is progressively significant with increasing
        
        
          tunnel depth, as illustrated in Figure 5. There is an outstanding
        
        
          increase in tunnel deformation at the depth of 1000 m for the
        
        
          SD model. In case additional reinforcement or modified
        
        
          excavation measure is not adopted, severe tunnel deformation
        
        
          may endanger tunnel stability. The strength degradation of
        
        
          marble beyond brittle failure plays an important role in the
        
        
          stability of deep tunneling.