1721
Technical Committee 204 /
Comité technique 204
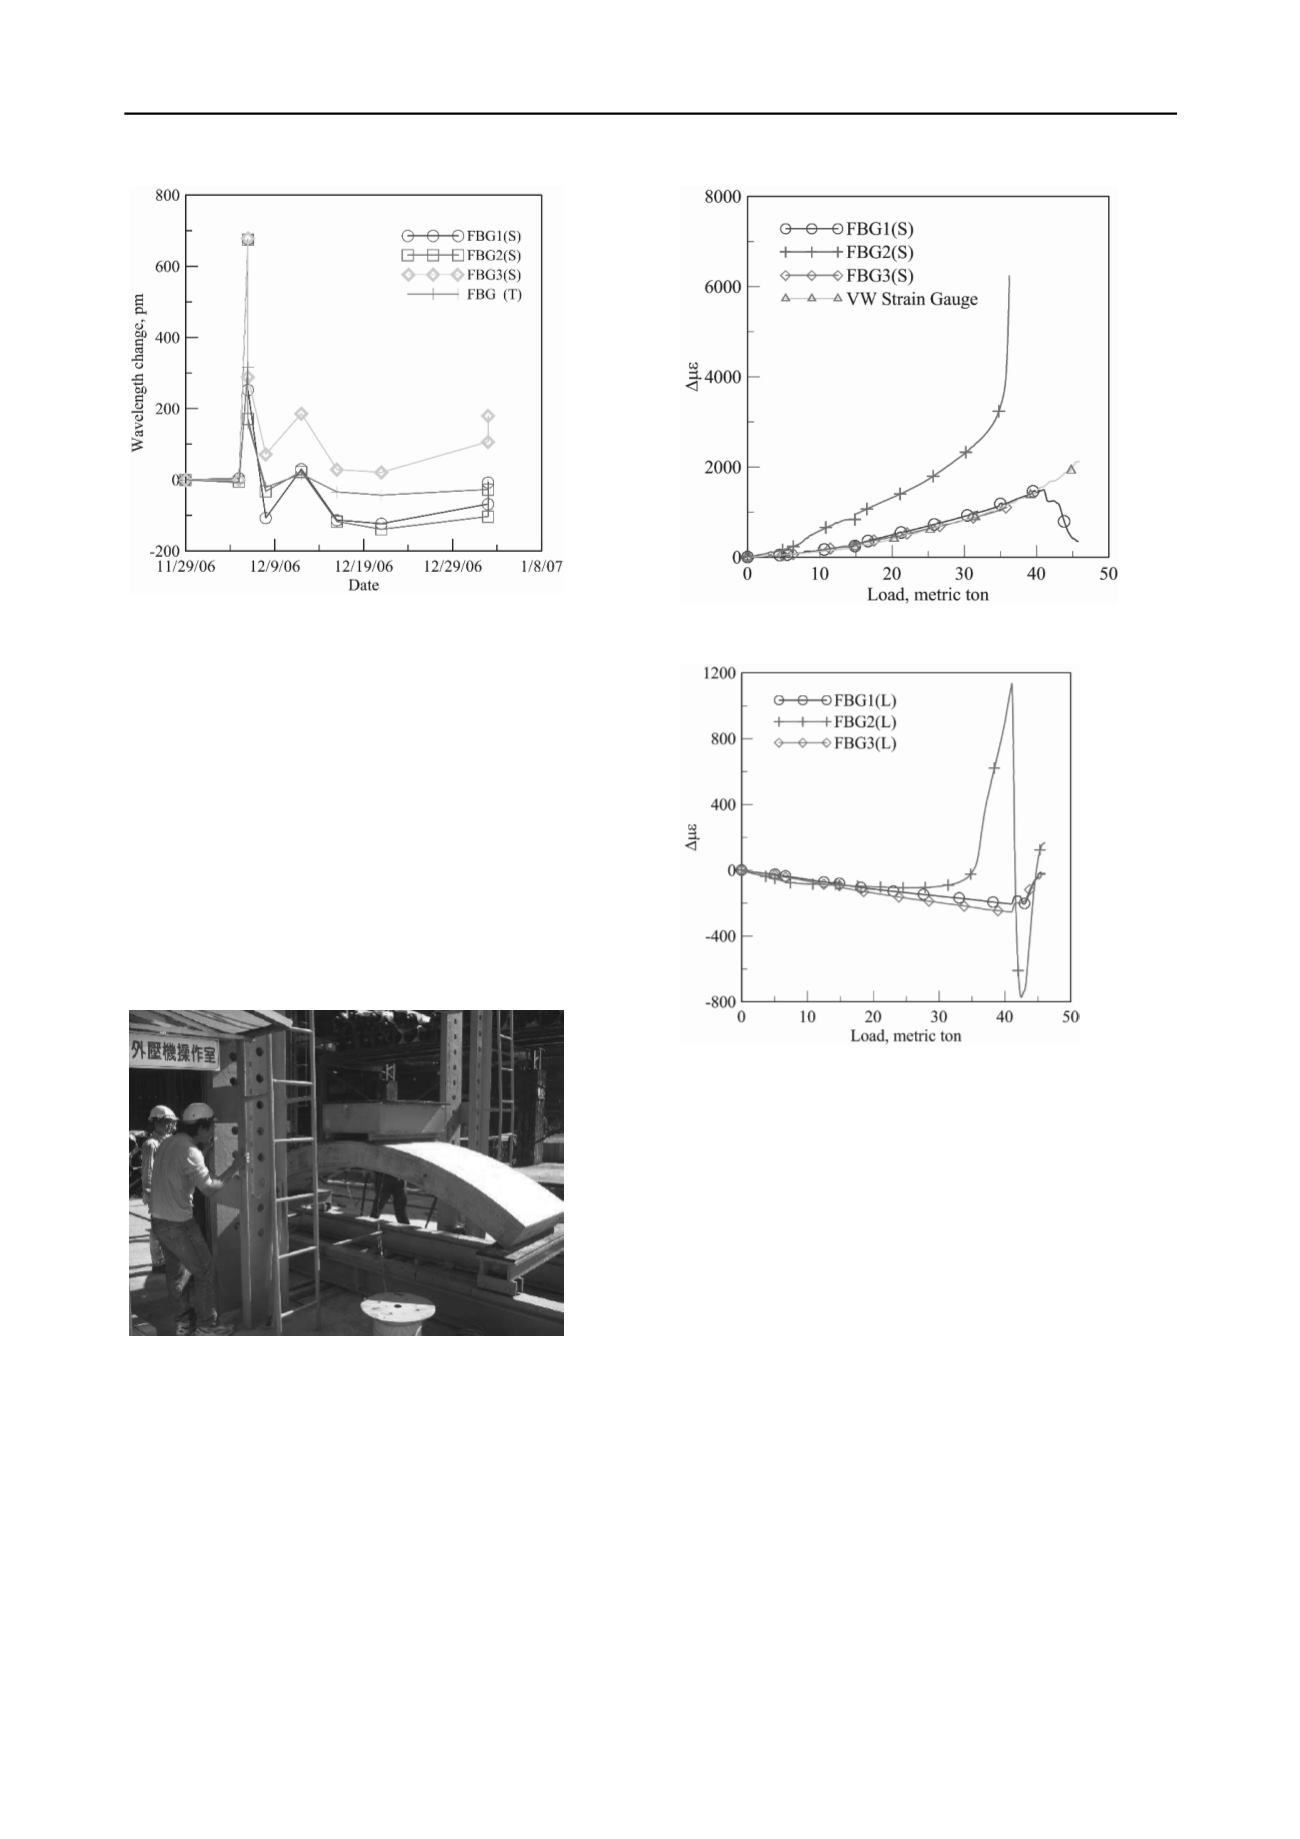
Figure 6. FBG wave length changes during the curing stage.
To verify the effectiveness of the sensors, an A1 panel with the
instruments installed as shown in Figure 3 was load tested under
compression. As depicted in Figure 7, the vertical load was applied at
the crown of the panel. The ends of the test panel were supported on
rollers to assure no bending. Figure 8 shows the change of strain (
)
from the FBG and VW strain sensors attached to the short steel. All
sensors showed tensile strain until breakage of the panel at
approximately 43 tons of loading. Being located at either the same or
compatible positions due to symmetry, strain readings from FBG1(S)
and FBG3(S) are very similar to those from the VW strain gage.
FBG2(S) had the most significant tensile strain readings because it was
subject to the maximum bending moment in load test. There was a sharp
increase in tensile strain in FBG2(S) near failure when cracking started
at the bottom of the panel and the stress became concentrated in the
steel. FBG sensors on the long steel, for the most part, were located in
the compression side during the load test.
Figure 7. Panel load test set up.
The FBG sensors on the long steel showed modest compressive strains
in the early stage of the load test. The strain readings in FBG2(L)
showed a reversal of strains from compressive to tensile at about the
same time when FBG2(S) started to have a sharp increase in its tensile
strain. This reversal is apparently also related to the cracking of the
panel at the bottom side. The strain readings in FBG2(L) reversed twice
towards the end of load test as the final bending of the panel was almost
entirely taken by the steel.
Figure 8. Change of strains from FBG’s on short steel.
Figure 9. Change of strains from FBG’s on long steel.
3 FBG STRAIN READINGS AFTER FIELD
INSTALLATIONS
The sensored panel was part of the shield tunnel section at 0k+399m of
the Taipei MRT Xinyi line contract CR580A, near the Daan Park station
(R9). The tunnel had an overburden of approximately 30m. The shield
tunnel boring machine was powered by multiple electric motors. During
field installation, the concrete panels were placed near these motors
with strong EMI. The fact that FBG signals are immune to EMI is an
important advantage, if readings are to be taken during the early stage of
panel insertion. Figure 10 presents the change of strains (
) recorded
in panel A1 immediately following its field installation on March 24,
2008. Fluctuations of strains were believed to be induced by assembling
various panels and back grouting. The readings became relatively stable
after one week of installation. FBG1(L) and FBG2(L) showed tensile
strains indicating that the tunnel lining was bulging slightly towards the
three o’clock direction. The rest of the strain readings were slightly in
the compressive side indicating that the tunnel lining was subject to
relatively modest earth pressure.
Long term automated data logging started on January 1, 2010 and
continued until April 26, 2012. During this period, the monitored
section was at least 500m behind the shield tunnel boring machine. The
long term strain readings as shown in Figure 11 generally ranged from
slightly positive (tensile) to as much as -500 micro strains (compressive).
The compressive strains were much more significant than those
recorded during the initial stage of panel installation. This is an
indication that two years after installation, the earth pressure had
exerted on the tunnel lining. Slight bulging remained in panels A1 and
B with strains in long steel close to the tensile side, while the reverse is
true for panel A3. The strain readings showed consistent fluctuations


