 
          1662
        
        
          Proceedings of the 18
        
        
          th
        
        
          International Conference on Soil Mechanics and Geotechnical Engineering, Paris 2013
        
        
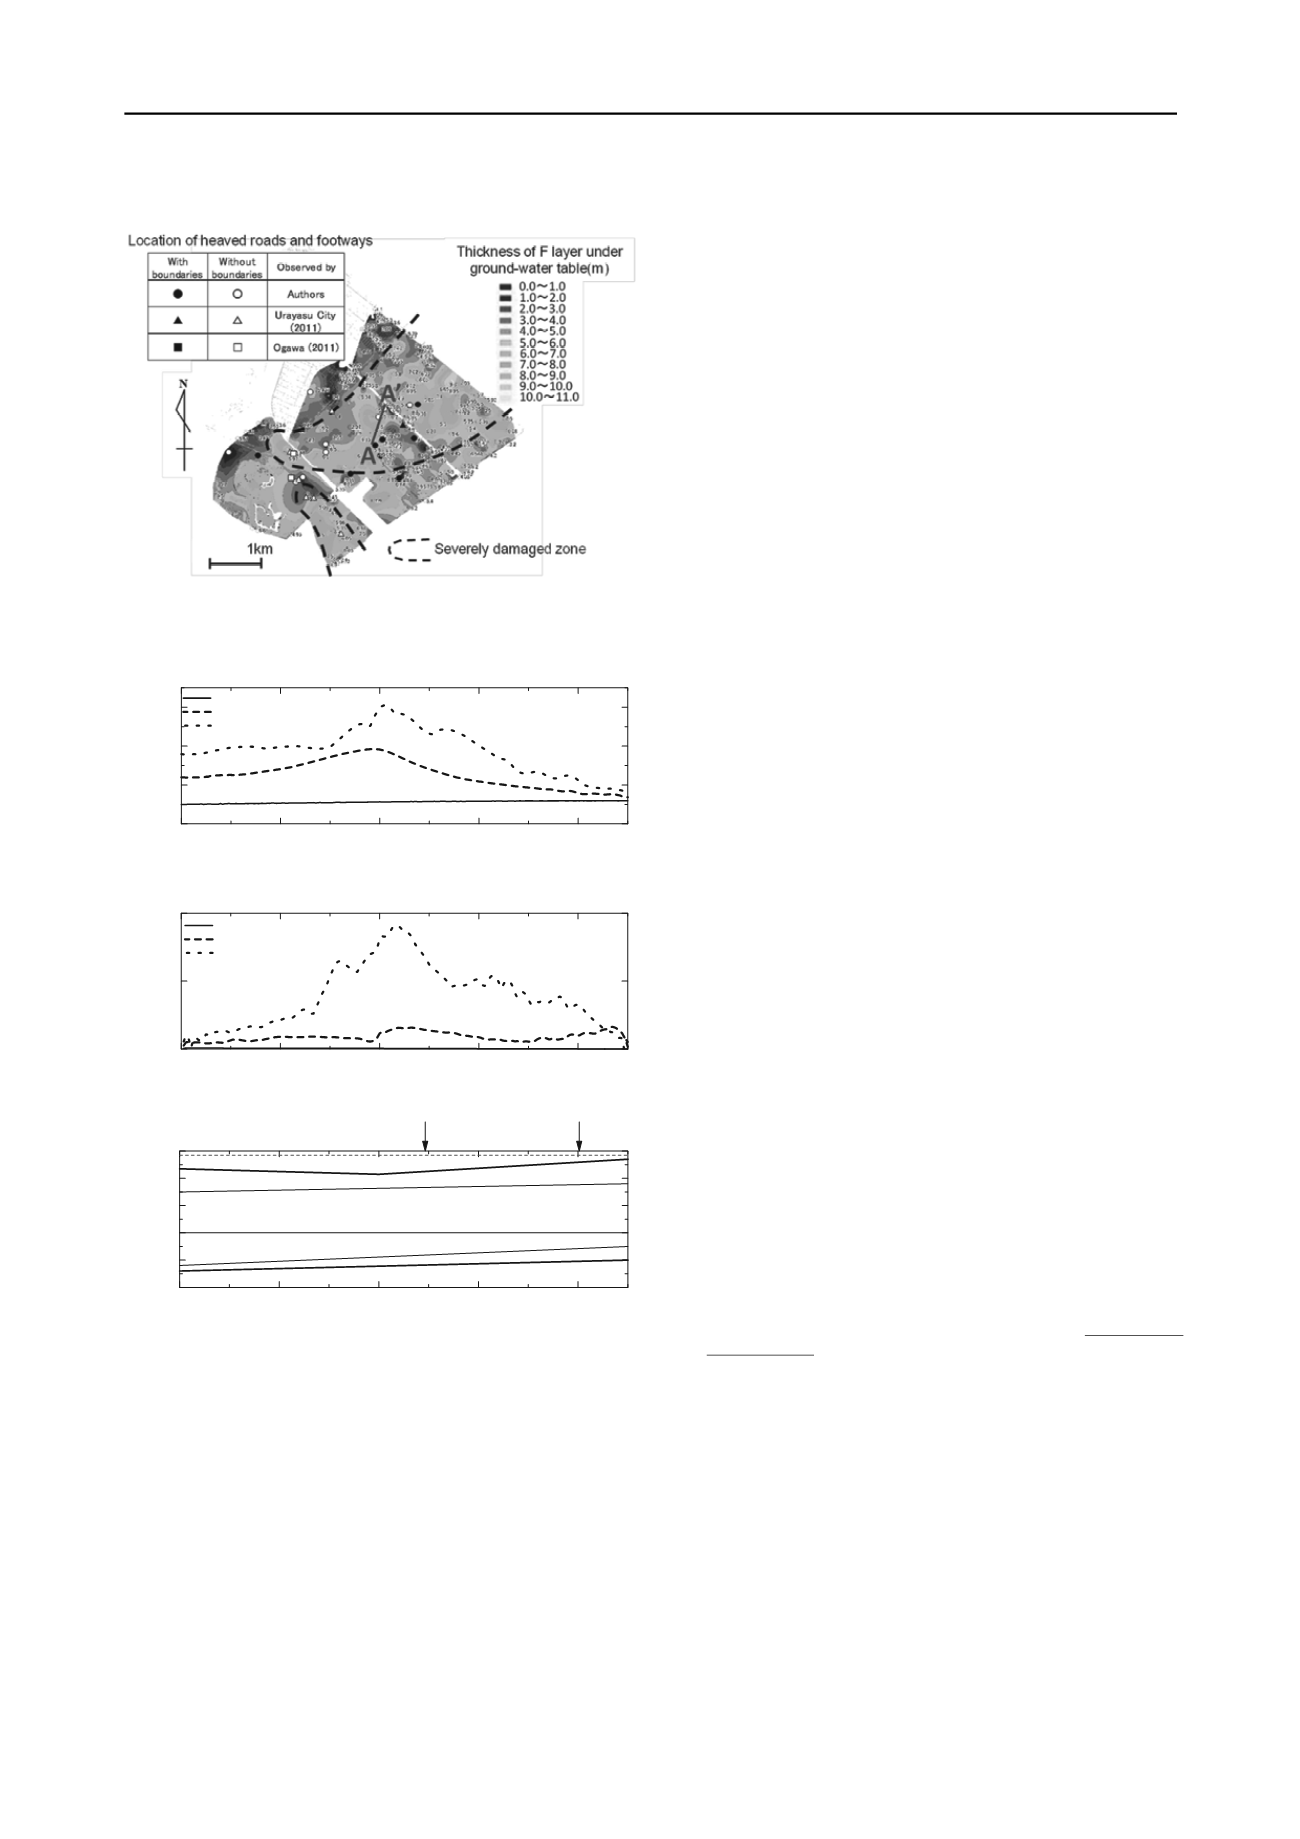
          boundaries, are plotted in Figure 14. By comparing the locations
        
        
          of heaved footways and alleys without boundaries with the
        
        
          contour lines of the thickness of the dredged and filled (F) layer
        
        
          under the ground water table, it is seen that heaving occurred at
        
        
          sites where the bottom of the dredged and filled layer, in other
        
        
          words, the liquefied layer, was sloped. This implies that a kind
        
        
          of horizontal buckling of the surface layer might have occurred
        
        
          due to the concentration of horizontal compressive stress, as
        
        
          schematically shown in Figure 13 (2).
        
        
          Seismic response analyses were carried out to estimate the
        
        
          concentration of horizontal compressive strain along line A-A’
        
        
          in Figure 14. Figure 15 (3) shows the soil cross section along
        
        
          line A-A’. In the analyses the “FLUSH” software program was
        
        
          used. The shear modulus in small strain,


            G


          0
        
        
          was estimated form
        
        
          SPT


            N


          -values, and the


            G


          /


            G


          0
        
        
          –
        
        
          γ
        
        
          and the


            h


          –
        
        
          γ
        
        
          relationships
        
        
          were estimated by the relationship proposed by Yasuda and
        
        
          Yamaguchi (1985). However, for the dredged and filled layer,


            G


          0
        
        
          was reduced to 1/50 and 1/100 to consider the effect of
        
        
          liquefaction, and


            G


          0
        
        
          was assumed to be constant regardless of
        
        
          shear strain
        
        
          γ
        
        
          . Many seismic records were obtained from the
        
        
          ground surface and from underground during the earthquake. Of
        
        
          these, the seismic wave recorded at Yumeno-shima, shown in
        
        
          Figure 1, was used for the analysis. Figures 15 (1) and 15 (2)
        
        
          show the distribution of the maximum horizontal displacement
        
        
          and compressive strain of the soil, respectively, at the depth of
        
        
          GL-1.5m. As shown in Figure 15 (2), large compressive strain
        
        
          is estimated to have been induced near the site where the thrust
        
        
          of a road occurred.
        
        
          Many sewage manholes were cracked and sheared in a
        
        
          horizontal direction and filled with muddy water, whereas a few
        
        
          manholes were lifted or slightly settled in Urayasu City. The
        
        
          large horizontal displacement of liquefied ground had to cause
        
        
          the disconnection of pipe joints and the shear failure of the
        
        
          manholes, allowing the influx of muddy water into the pipes
        
        
          and manholes.
        
        
          Figure 14 Estimated thickness of dredged and filled layer under water
        
        
          table (Quoted from the report by the Technical Committee organized
        
        
          by Urayasu City, 2012) and locations of heaved roads and footways
        
        
          5 CONCLUSION
        
        
          Laboratory tests, model tests and seismic response analyses
        
        
          were carried out to explain the remarkable behavior of the
        
        
          ground due to liquefaction in the Tokyo Bay area during the
        
        
          2011 Great East Japan Earthquake, and the followings
        
        
          conclusions were derived:
        
        
          (1) Seismic intensities in the liquefied zones were not high, with
        
        
          peak surface accelerations of 160 to 300 cm/s
        
        
          2
        
        
          , though the
        
        
          liquefied ground was covered with boiled sands. The very long
        
        
          duration of the main shock and an aftershock 29 minutes later
        
        
          should have induced the severe liquefaction.
        
        
          (2) It is estimated that much eruption of sands and large ground
        
        
          subsidence occurred because the liquefied soil had much fines
        
        
          and was easily lifted above the ground surface by the ejecting
        
        
          water.
        
        
          (3) A kind of horizontal buckling of the surface layer might
        
        
          have occurred due to the concentration of horizontal
        
        
          compressive strain of liquefied ground and caused the strange
        
        
          heaving, buckling or thrust of the footways and alleys.
        
        
          6 REFERENCES
        
        
          Japan Road Association 1996. Specification for highway bridges. (in
        
        
          Japanese).
        
        
          Kanto Regional Development Bureau of the Ministry of Land,
        
        
          Infrastructure, Transport and Tourism 2011. Study on the
        
        
          liquefaction in Kanto Region during the Tohoku-Pacific Ocean
        
        
          earthquake.  (in Japanese)
        
        
          National Research Institute for Earth Science and Disaster Prevention
        
        
          (NIED). K-NET WWW service, Japan  


          -
        
        
          net.bosai.go.jp/).
        
        
          Urayasu City. 2012. Report on measures against liquefaction in Urayasu
        
        
          City, (in Japanese)
        
        
          Yasuda, S. and Yamaguchi, I. 1985. Dynamic soil properties of
        
        
          undisturbed samples.


            P


          roc.


            of the 20


            th


            Japan National Conf. on


            SMFE


          ,539-542. (in Japanese)
        
        
          Yasuda, S. 2009. Estimation of earthquake-triggered flood in a subsided
        
        
          area,


            Proc. of the 17


            th


            International Conference on Soil Mechanics


            & Geotechnical Engineering


          , 1686-1689.
        
        
          Yasuda S., Harada K., Ishikawa K. and Kanemaru Y. 2012.
        
        
          Characteristics of the Liquefaction in Tokyo Bay Area by the 2011
        
        
          Great East Japan Earthquake.


            Soils and Foundations


          , (in printing)
        
        
          Figure 15. Results of seismic response analyses to estimate the
        
        
          concentration of horizontal compressive strain
        
        
          (1) Maximum horizontal displacement
        
        
          (2) Maximum compressive strain
        
        
          (3) Soil cross section along A-A’ line
        
        
          0
        
        
          200
        
        
          400
        
        
          600
        
        
          800
        
        
          0
        
        
          20
        
        
          40
        
        
          60


            G


          0
        
        
          was not reduced


            G


          0
        
        
          was reduced to 1/50


            G


          0
        
        
          was reduced to 1/100
        
        
          Maximum horizontal
        
        
          displacement(cm)
        
        
          distance(m)
        
        
          1
        
        
          0
        
        
          200
        
        
          400
        
        
          600
        
        
          800
        
        
          0
        
        
          0.5


            G


          0
        
        
          was not reduced


            G


          0
        
        
          was reduced to 1/50


            G


          0
        
        
          was reduced to 1/100
        
        
          Maximum strain(%)
        
        
          distance(m)
        
        
          50
        
        
          0
        
        
          200
        
        
          400
        
        
          600
        
        
          800
        
        
          0
        
        
          10
        
        
          20
        
        
          30
        
        
          40
        
        
          distance(m)
        
        
          Height(m
        
        
          Clay
        
        
          Sand
        
        
          Clay


            Alluvial layer


            Diluvial layer


          )


            F


            (


            Liquefied layer


            )


          Sand


            A


            A'


          Thrust of a roads