1660
Proceedings of the 18
th
International Conference on Soil Mechanics and Geotechnical Engineering, Paris 2013
100
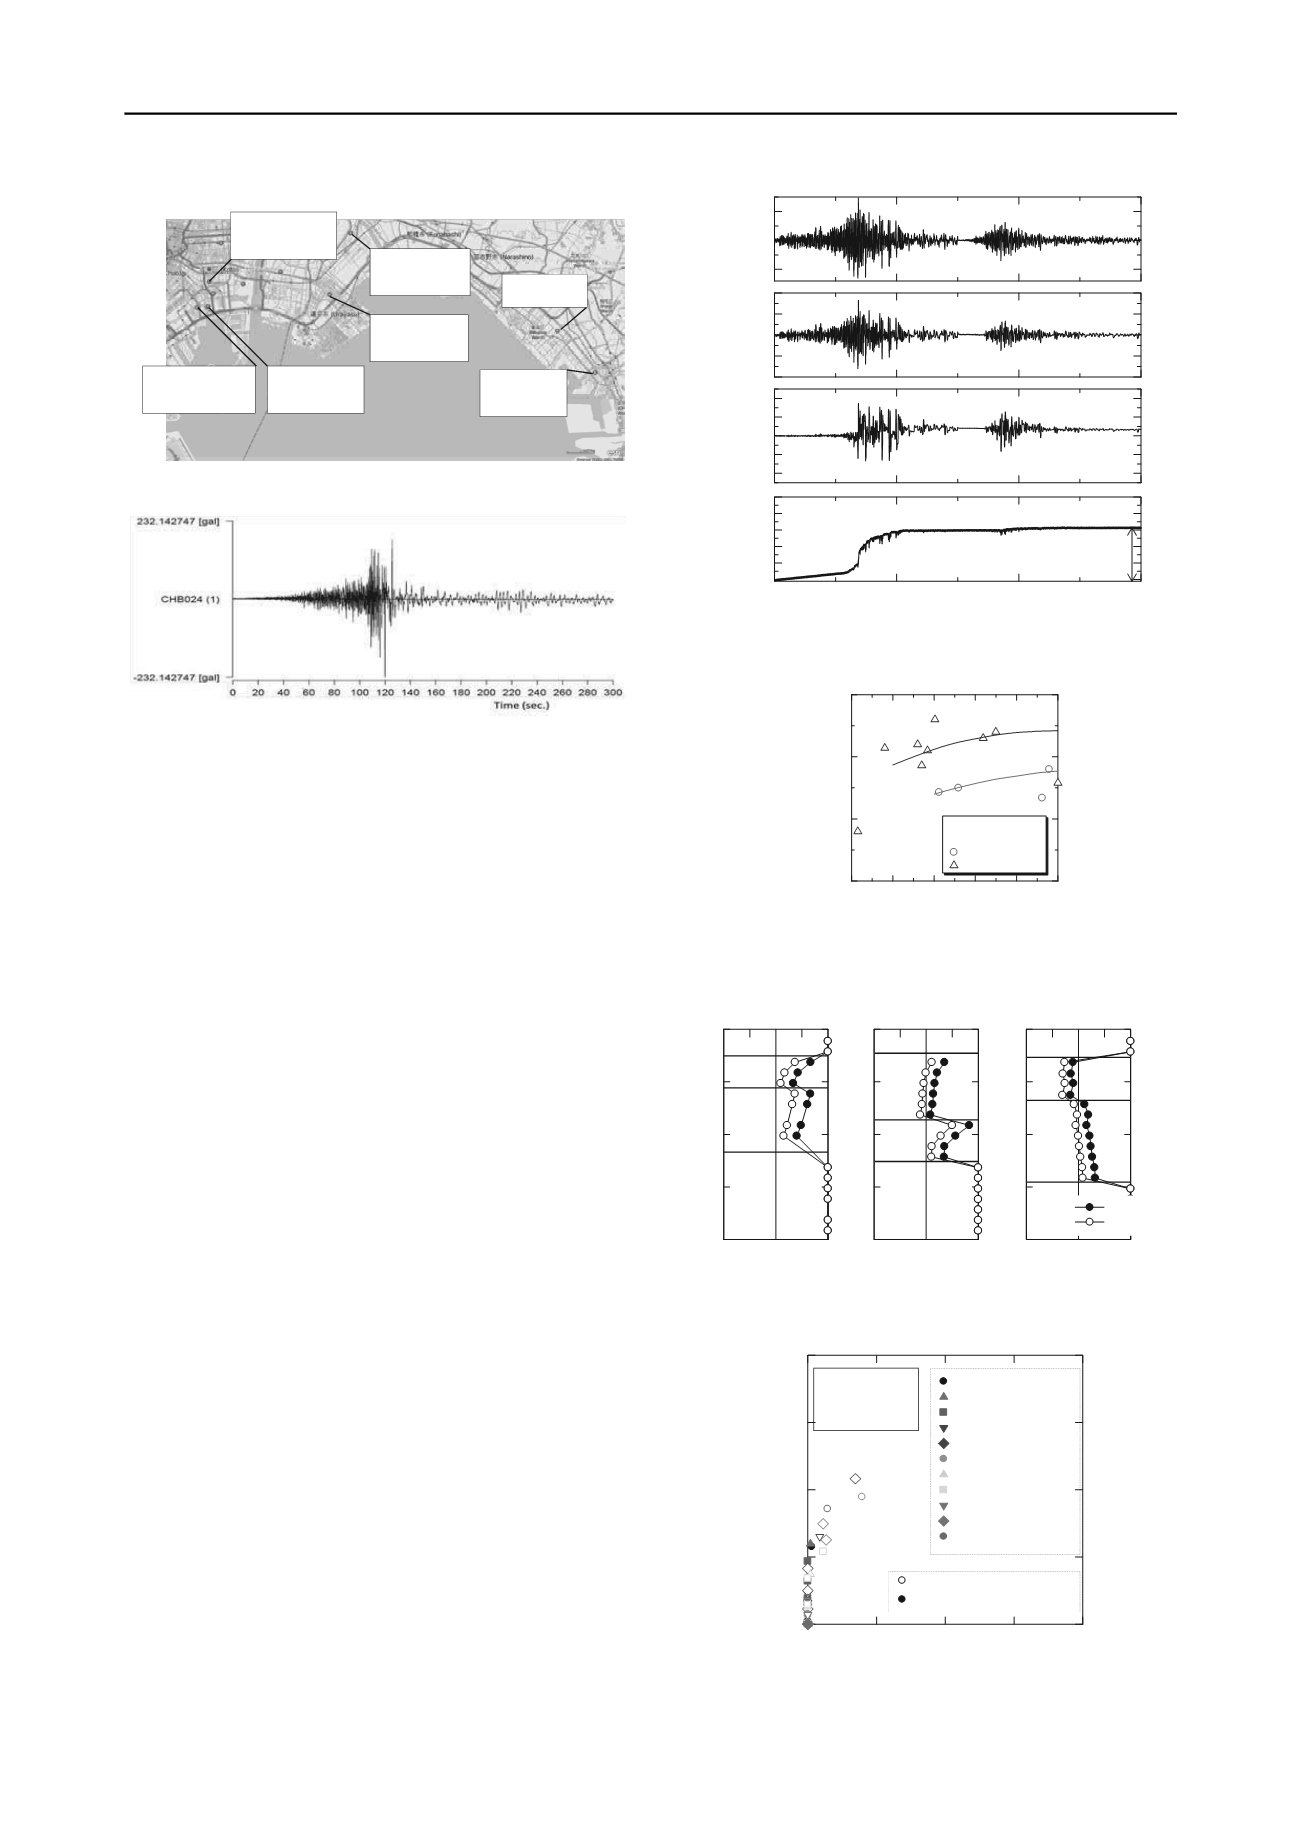
(NIED, 2011) during the main shock and an aftershock 29
minutes later. Surface accelerations were not high, around 160
cm/s
2
to 300 cm/s
2
, in the liquefied zones. Figure 3 shows the
accelerograph at Inage, where boiled sand was observed. The
frequency fell to low values after two peaks at 120 sec. and 126
sec. This means that a long duration of shaking, around 1
minute, might have caused liquefaction at the K-NET Inage site.
Shaking continued for a long time after the occurrence of
liquefaction.
According to inhabitants of the area, the boiling of
muddy water was not intense after the main shock, somewhat
like an oozing out. However, boiling intensified during the
aftershock (Yasuda et al., 2012). Some inhabitants testified that
boiling did not occur during the main shock but occurred during
the aftershock. The authors conducted cyclic torsional shear
tests and some simple analyses to evaluate the effect of the long
shaking on the occurrence of liquefaction.
Silty sand taken from the boiled sand in Urayasu City was
used for the cyclic torsional shear tests. The fines content,
maximum void ratio and minimum void ratio were 36%, 1.477
and 0.828, respectively. The silty sand was poured into a mold
with a relative density of 90 %. Two types of shear wave were
applied to the specimen, a sine wave of 20 cycles and the
seismic wave recorded during the main shock and the
aftershock at the K-NET Urayasu site. In the case of seismic
wave, excess pore water pressure increased gradually with shear
stress as illustrated in Figure 4. The relationships between the
stress ratio
R
(τ
d
/σ’) for the sine wave or
R
max
(τ
max
/
σ
’) for the
seismic wave and residual excess pore water pressure
u
/
σ
c
’ are
plotted in Figure 5. As
R
=0.27 for
u
/
σ
c
’=1.0 and
R
max
=0.31 for
u
/
σ
c
’=1.0, the correction factor
C
w
according to the JRA
standard (JRA, 1996) becomes 0.82. The safety factor against
liquefaction
F
L
and the liquefaction potential
P
L
were evaluated
from the data gathered from boring sites along the 11 soil cross
sections shown in Figure 1, under the conditions of
C
w
=0.82
and 1.0. In the estimation,
R
L
was estimated from SPT
N
-values
and fines content
F
c, using the formula proposed by the
technical committee of Urayasu City (Urayasu City, 2012).
Figure 6 shows the
F
L
values evaluated from boring data from
Urayasu, where liquefaction occurred. If the
C
w
is assumed be
1.0, most of
F
L
are estimated to be greater than 1.0, whereas
F
L
are less than 1.0) if
C
w
is assumed to be 0.82. Figure 7 compares
Figure 2 Ground surface accelerations measured by K-net (NIED,
2011) during the main shock and an aftershock 29 minutes later
Figure 3 Acceleration wave measured by K-NET Inage during the
main shock
Tatsumi[TKY017]
Main:224.4 Gal
After:141.9 Gal
Shinonome[TKY016]
Main:168.8 Gal
After:64.1 Gal
Shiohama[TKY020]
Main:152.5 Gal
After:77.1 Gal
Urayasu[CHB008]
Main:174.3 Gal
After:82.3 Gal
Gyotoku[CHB029]
Main:166.8 Gal
After:87.7 Gal
0
-100
Inage[CHB024]
Main:166.8 Gal
Chiba[CHB009]
Main:187.1 Gal
After:80.6 Gal
Stress ratio, R (
τ
/
σ
') or
Rmax (
τ
max/
σ
')
Pore water pressure ratio
0 0.2 0.4 0.6 0.8 1
0.1
0.2
0.3
0.4
Urayasu sand
Dr=90%
Sine wave
Seismic wave
Figure 5 Relationship between shear stress ratio and excess pore
water pressure
0
5 10 15 20
0
5
10
15
20
P
L
(
C
w=1.0)
P
L
(
C
w=0.82)
Shinonome1-1'
Shinkiba1-1'
Shinkiba2-2'
Urayasu1-1'
Urayasu2-2'
Urayasu3-3'
Funabashi1-1'
Narashino1-1'
Narashino2-2'
Chiba MIhama1-1'
Chiba Mihama2-2'
Liquefied area
Non-Liquefied area
K
hg
(A
max
/g) is
assumed as 0.18
Figure 7 Effect of
C
W
on
P
L
Figure 4 Time histories of shear stress, shear strain and excess pore
water pressure
-20
-10
0
10
20
-4
-2
0
2
4
0
0.2
0.4
0.6
0.8
1
Recorded
acceleration
A (cm/s
2
)
Shear stress
τ
(kN/m
2
)
Shear strain
γ (%)
Pore water
pressure
Ratio (u/σ’)
R
max
=τ
max
/σ
’=0.330
Main
shock
Aftershock
Residual P. P. R.
K-NET Urayasu
Figure 6 Analyzed
F
L
at liquefied sites in Urayasu City
0
5
10
15
20
0
1
2
F
L
Depth(GL.-m)
0
5
10
15
20
0
1
2
F
L
Depth(GL.-m)
0
5
10
15
20
0
1
2
F
L
Depth(GL.-m)
Mihama 3-chome
Imagawa 2-chome
Takasu
B
F
As
Ac
B
F
As
Ac
B
F
As
Ac
Dep (m)
C
w
=1.0
C
w
=0.82


