1657
Technical Committee 203 /
Comité technique 203
connected each potentiometer to the geogrid at the three
designated levels. The fourth potentiometer was connected to
the shake table in order to measure the actual seismic motions
generated by the actuator. The potentiometers were spring-
loaded, but the spring force was significantly smaller than the
seismic force and therefore did not affect the responses of the
walls. The vertical settlements of the MSE wall during the
shaking were measured by LVDT transducers that were
anchored on the shake table above the concrete slab. The
transient vertical effective stresses in the backfill were
measured using dynamic soil pressure cells, which were placed
flat at the bottom of layers 1, 3, 4, and 5. Wire-free
accelerometers were embedded in each of the five layers and
were close to the wall face in order to measure the acceleration
responses of the backfill. One accelerometer was attached to
the shake table and one to the box to measure their acceleration
responses as well. A delayed start timer was set in each
accelerometer, and the data recording (100 data per second)
started at a predetermined time when the shake table test was
scheduled to run.
In order to simulate the natural retained soil on the back of
and beneath the MSE wall, spring-loaded boards were installed
at the back-side and the bottom of the box. The springs were so
chosen to provide the same
dynamic stiffness
of dense sand,
following the approach suggested by Gazetas (1991). Due to
the page limitation, the detailed design of the spring boards is
omitted.
2.3 Dynamic Scaling
In this research, the 7.1 magnitude Loma Prieta earthquake of
1989 in Northern California, USA, was simulated. The duration
of the displacement-time history was 40 seconds. The
earthquake’s displacement-time history and acceleration-time
history data were from the Pacific Earthquake Engineering
Research (PEER) Center Library of University of California,
Berkeley and were implemented into the input file to the
MTS
control system of the shake table. Trial shake table tests
were run on the empty box, the input and measured
displacements and accelerations matched well.
The reduced-scale model MSE wall was intended to
simulate a prototype wall of full scale. The geometric scale was
chosen to be 1:3 (model:prototype), that is, the model MSE
wall simulated an MSE wall of 4.5 m tall in the field. The
dynamic stress was scaled based on the dynamic scaling law
for the “adequate model” (Moncarz and Krawinkler 1981):
a
r
L
r
1
(1)
where: dimensional scale
, acceleration
L
r
L
model
:
L
prototype
1: 3
3 :1
scale
. Therefore, the input accelerations
were three times of the actually recorded accelerations in the
field.
a
r
a
model
:
a
prototype
3 RESULTS AND DISCUSSION
The original acceleration-time history for the Loma Prieta
earthquake recorded at the particular site had a maximum
acceleration of 0.54 g. This value was multiplied by 3,
according to Equation (1), so that the input maximum
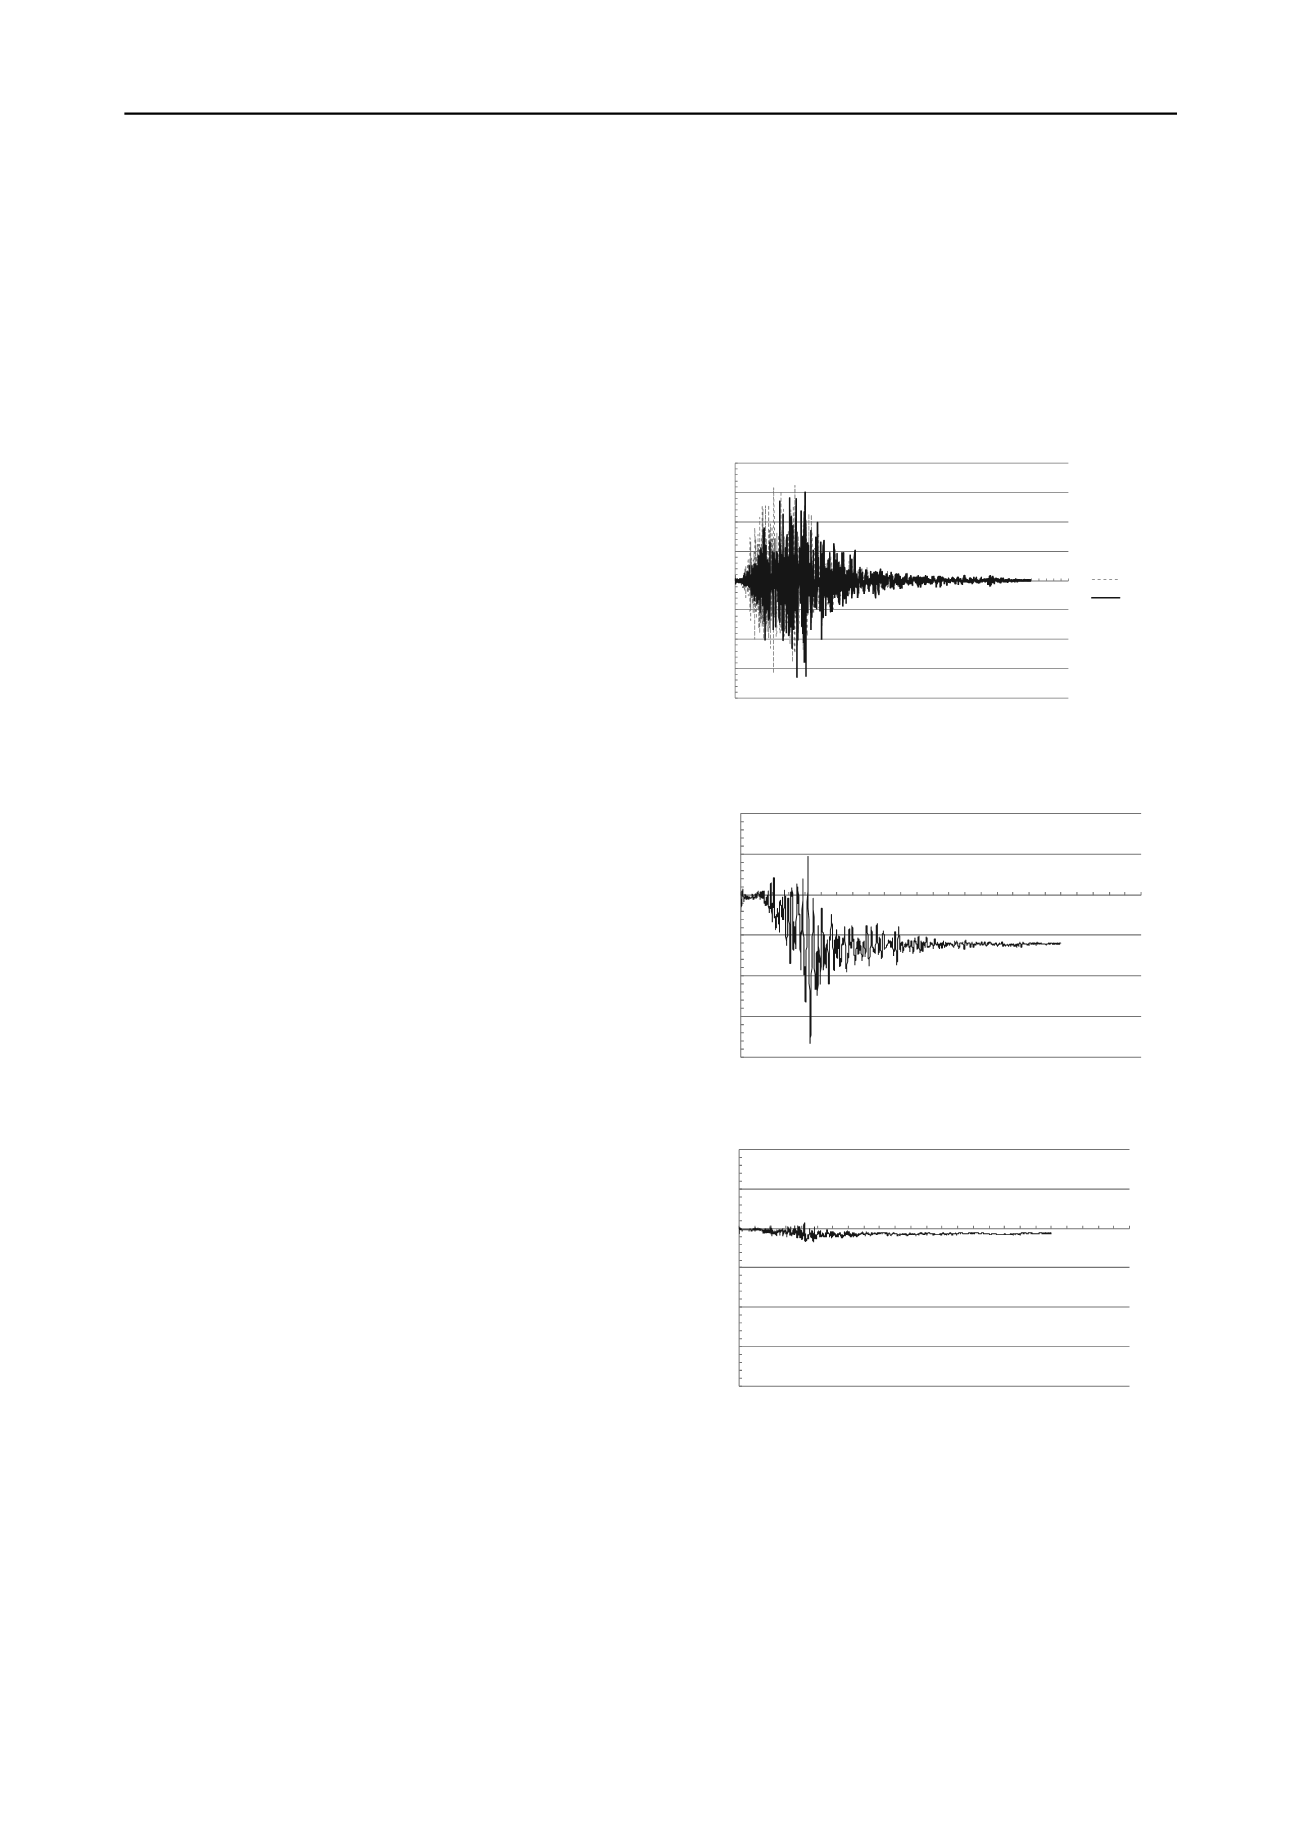
acceleration was 1.62 g in the model test. Figure 5 shows the
input ground acceleration-time history and the measured
acceleration-time history of the shake table. It is clear to see
that the input values are similar to the measured values. The
difference may be due to the weight of the box and the MSE
wall, which caused the box to be heavy and moving less.
Figure 6 shows the lateral deflections of the MSE wall face
at the bottom and top layers during the 40-second shaking. The
deflections were obtained by subtracting the absolute,
measured displacements of the table from the absolute,
measured displacements of the wall face at each time stamp.
The maximum displacement of each layer matched well with
the acceleration variation of the table shown in Figure 5
the
maximum displacement occurred at the same time when the
acceleration was the highest. The top layer had the maximum
horizontal deflection of positive 2.0 cm (into the wall) and
negative 7.0 cm (away from the wall). The bottom of the wall
had the least movements between positive 0.3 cm and negative
0.6 cm. The maximum deflection of the wall face was 4.7% of
the wall height. Bulging was not noticeably observed.
-2
-1.5
-1
-0.5
0
0.5
1
1.5
2
0
5
10 15 20 25 30 35 40 45
Acceleration(g)
Time (sec)
Input
Output
Figure 5. Scaled Loma Prieta earthquake acceleration-time history
(a) Top layer displacement
-8
-6
-4
-2
0
2
4
0
10
20
30
40
5
Displacement (cm)
Time (sec)
0
-8
-6
-4
-2
0
2
4
0
10
20
30
40
Displacement (cm)
Time (sec)
50
(b) Bottom layer displacement
Figure 6. Lateral displacements/deflections of TDA wall face, relative
to table movement
Table 1 lists the measured maximum accelerations in each
layer of the MSE wall during the test. The maximum
acceleration of the shake table was 1.89 g. The measured
accelerations generally increased toward the top of the wall,
matching well with the increased lateral displacements from the
bottom to the top of the wall face.


