1656
Proceedings of the 18
th
International Conference on Soil Mechanics and Geotechnical Engineering, Paris 2013
0
10
20
30
40
50
60
70
80
90
100
0.1
1
10
100
Percent Finer by Mass (%)
Aggregate Size (cm)
Figure 1. Size distribution of the TDA
Young’s modulus of the TDA was also obtained using a
large-scale compression test. The dimensions of the TDA
sample in the compression test was 112 cm long, 71 cm wide,
and 50 cm tall and was confined in a wooden box. The stress-
strain relationship, which was not included in this paper due to
page limit, showed an apparent upswing trend as the
compressive deformation continued. Within 10% strain, the
curve appeared to be a linear line, and the Young’s modulus of
the TDA is approximately 400 kN/m
2
. The bulk density of the
TDA in the backfill was 721 kg/m
3
, which is at the lower end
of the density range that is used in the engineering practice.
Higher density was not able to be reach due to the compaction
capability in the lab. In order to obtain the shear resistance of
the TDA, large scale shear testing was conducted. The shear
resistance of the TDA was found to be approximately
c
= 0,
=
30
.
2.2 Experimental Setup
Figure 2. Shake table
A section of reduced-scale MSE wall was built in a 1.5 m
1.87 m
1.8 m rigid steel box that was anchored on a 2.4 m
2.1 m one-dimensional shake table. The load capacity of the
shake table is 177.9 kN, the actuator provides 245 kN of
hydraulic driving force, and the maximum travel distance of the
table is
12.7 cm. The shake table is capable of replicating
recorded historical earthquake motions that are within the
table’s allowable displacement range. Figure 2 is a photo of the
shake table and the box with a retaining wall built inside.
Figure 3 shows the completed model MSE wall with TDA
backfill.
The model MSE wall’s configuration is shown in Figure 4.
The wall was 1.5 m high, 1.2 m deep, and 1.5 m long. Five
wrap-around layers of reinforced TDA were used. Uniaxial
geogrid was used for both reinforcement and containment of
the TDA. The spacing and length of each reinforcement layer
were determined according to the “Geosynthetic Design &
Construction Guidelines Reference Manual” (FHWA 2008)
and “Designing with Geosynthetics” (Koerner 2005).
Figure 3. Constructed model MSE wall
The design parameters for the geogrid reinforcement are
listed as follows:
Ultimate tensile strength:
T
ult
= 54 kN/m
Total reduction factors:
RF
= 3.6
Allowable tensile strength:
T
all
T
ult
RF
54
3.6
15 kN/m
Factor of safety for pullout failure: FS = 1.5
Height of wall (prototype):
H
= 4.5 m
External friction angle (
) between geogrid and TDA:
assume
=
TDA
= 30
Adhesion between geogrid and TDA:
c
a
= 0.
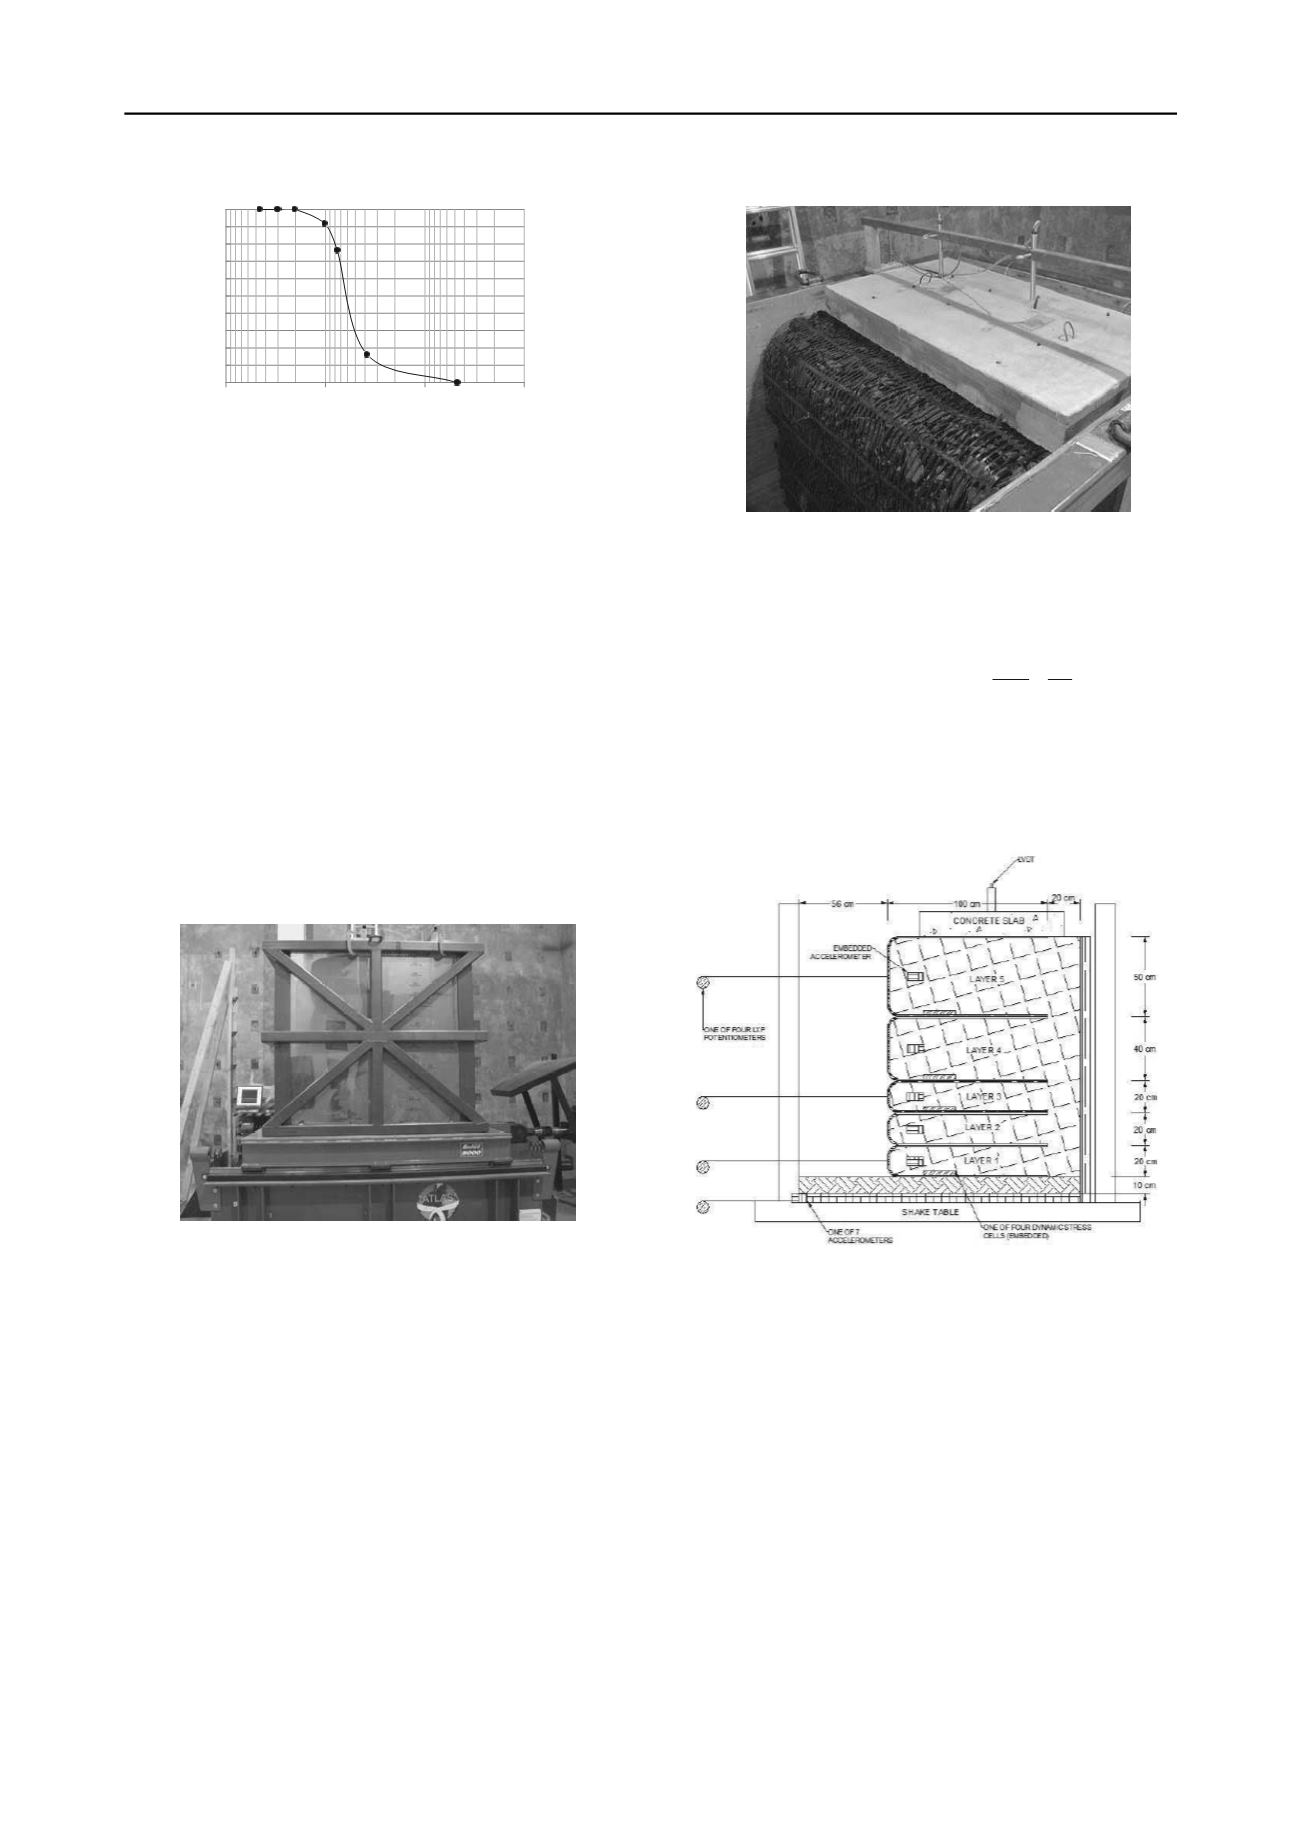
Figure 4. Configuration and instrumentation of MSE wall
Beneath the first layer of the TDA, a 10 cm sand layer was
compacted to simulate the friction of the base soil. It is noted
that in each of the wrap-around layer, the top geogrid sheet is
only half of the length of the bottom geogrid sheet for that
layer, since the top wrap-around sheet was not intended to
serve as a reinforcement layer. The TDA were compacted using
a 15 kg hand hammer with a long handle and 30 cm
30 cm
steel base to reach the target density of 721 kg/m
3
. A concrete
slab was placed at the top of the wall and anchored to the top
layer with ten steel rebar, so that the slab did not move freely
during the shaking. The concrete slab simulated a surcharge of
3.4 kN/m
2
. Transparent Plaxiglas sheets were used at the
interface between the TDA wall and the sides of the box to
minimize the friction between the TDA and the boundaries.
Figure 4 also depicts the instrumentations used in the model
test. Three linear potentiometers were used to measure the
horizontal deflections of the wall face at the bottom, middle,
and top layers. The potentiometers were fixed to an inertial
frame outside of the shake table, and an inelastic wire


