1664
Proceedings of the 18
th
International Conference on Soil Mechanics and Geotechnical Engineering, Paris 2013
Proceedings of the 18
th
International Conference on Soil Mechanics and Geotechnical Engineering, Paris 2013
2
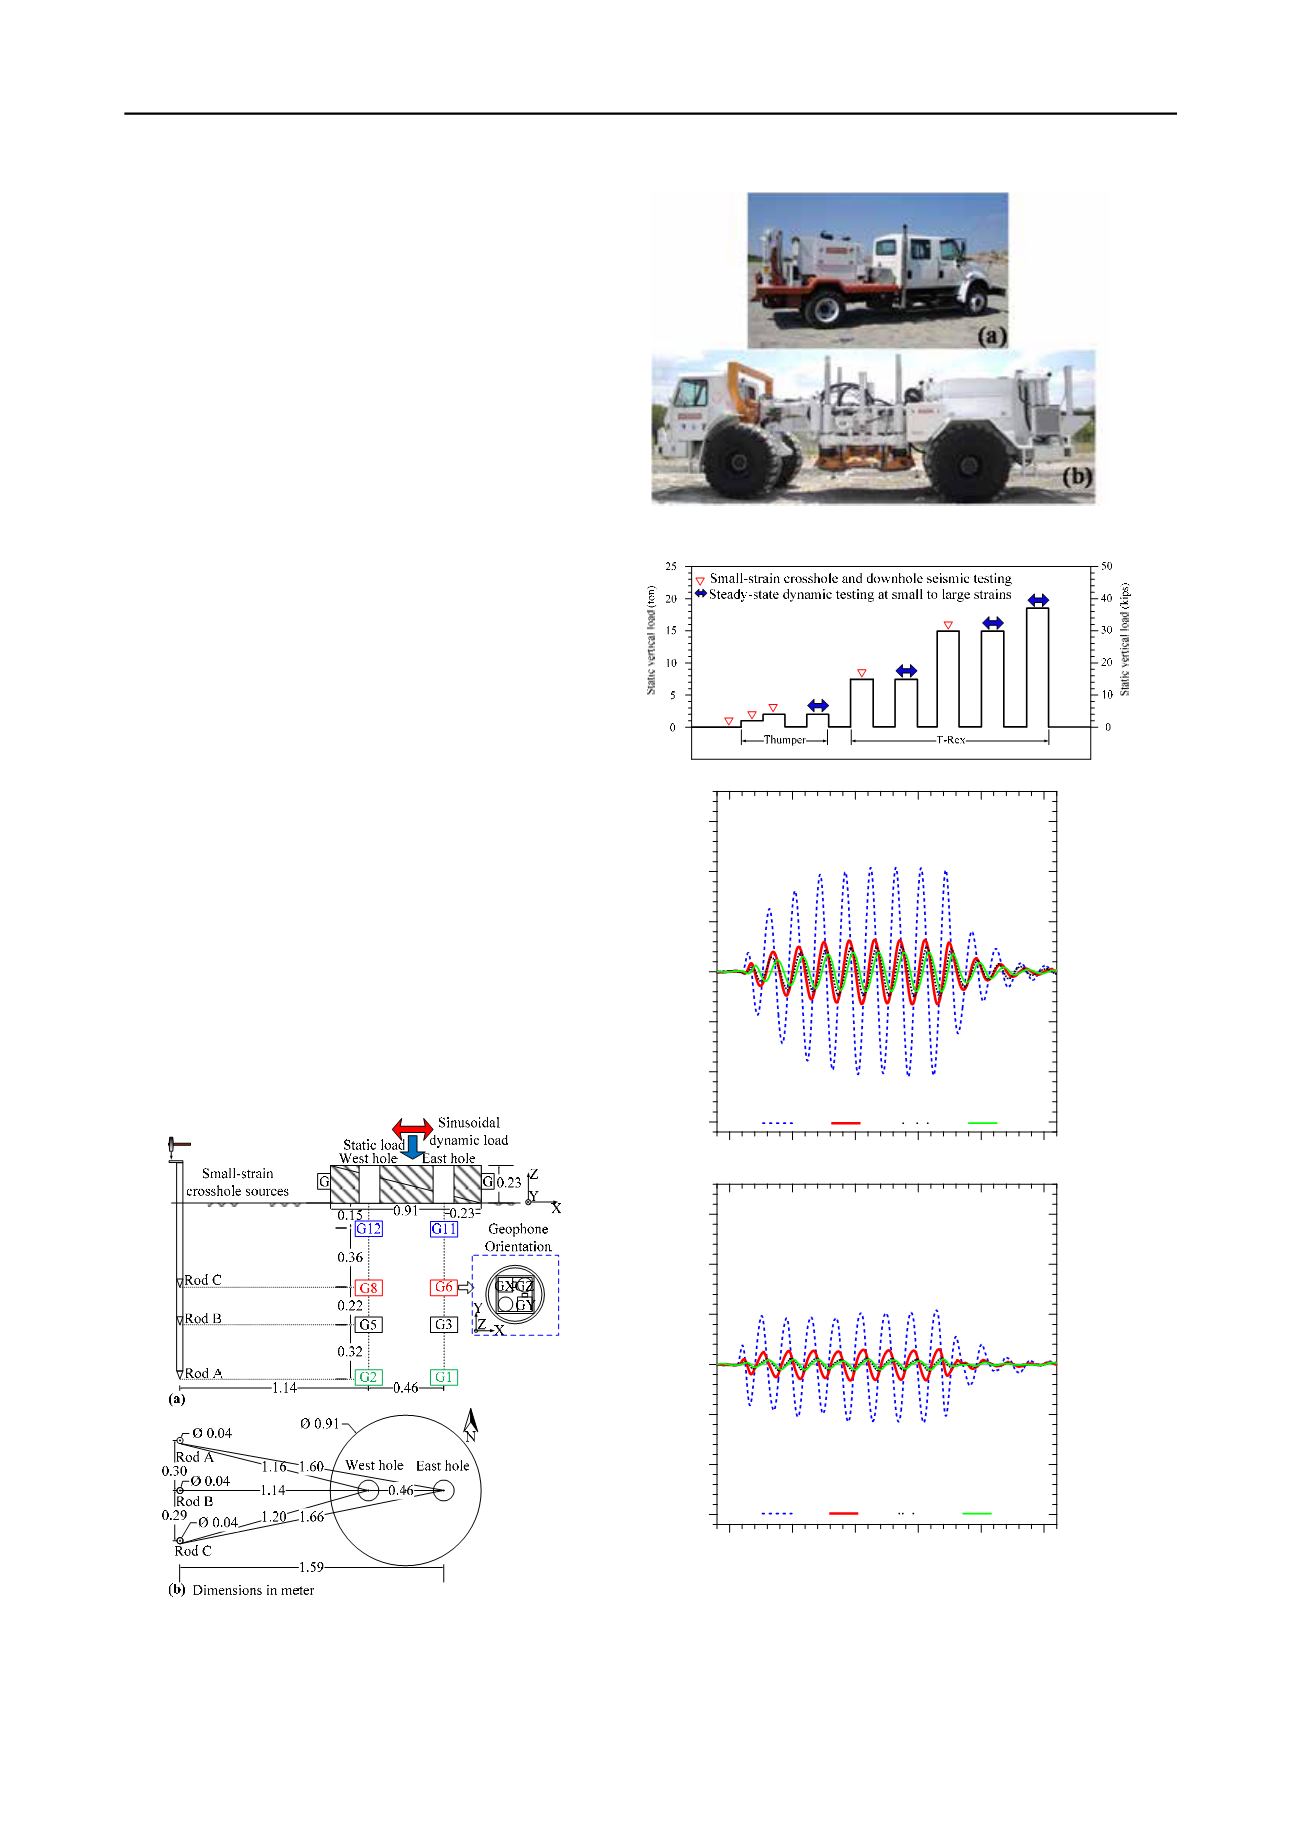
used for the low ground pressure tests and T-Rex was used for
higher ground pressure tests.
The mobile shakers were first used to apply a static vertical
load increment on the foundation. The foundation settlement
during static load application was measured from spanning
beams. The vertical load was varied, allowing for an in situ
assessment of the effect of vertical stress in the MSW. The
sequence of applied vertical loads is shown in Fig. 3. At each
vertical load increment, small-strain crosshole and downhole
seismic testing was performed. Then, a 30-50 Hz sinusoidal
horizontal load at increasing load amplitudes was applied by the
mobile shakers and the ground motion was captured by the
geophones embedded in the waste. Upon completion of testing,
the waste was excavated and in situ unit weight tests were
performed as described in Zekkos et al. (2006).
3 DATA INTERPRETATION
The waves generated during cyclic loading by the mobile
shakers propagated downwards and were sensed by three-
component geophones in each vertical array. Examples of
dynamic loading time histories in the horizontal and vertical
directions of shaking are shown in Figs. 4a and 4b, repectively.
Shear wave velocity was calculated using the travel time of the
waves that propagate from the shallower to the deeper sensors.
The equivalent shear modulus was calculated using the in-situ
measured MSW unit weight. To assess the shearing strain
amplitude, the three-component displacement time history was
calculated by integrating the recorded velocity time history. A
4-node element was used by selecting pairs of geophones at two
different depths (Chang 2002) and the shearing strain time
history was then calculated for the element, as shown in Fig. 5.
Use of a 2-node approach (one sensor at each depth) or ignoring
the vertical displacement component (shown in Fig. 4b) in
calculating the shearing strain was found to underestimate the
shearing strain.
At each vertical load increment, vertical and horizontal stress
distributions were calculated using Foster and Ahvlin (1954).
By varying the dynamic load from low to high amplitudes, the
shear modulus reduction was evaluated. The effect of confining
stress on the shear modulus reduction was evaluated by varying
the vertical load increment. Different pairs of geophones were
selected to define a 4-node element, as shown in Fig. 6, to allow
an in-situ assessment of MSW variability.
Figure 1: Schematic of the testing setup at location #1: (a) cross-section;
(b) plan view.
Figure 2: Photographs of large mobile shakers used to apply static and
dynamic loads to the MSW: (a) Thumper and (b) T-Rex.
Figure 3. Sequence of static loading and dynamic testing at location #1
Figure 4. Time-history records from the four geophones (G2, G5, G8,
G12) in one vertical array: (a) X axis (horizontal shaking direction) and
(b) Z axis (vertical shaking direction).
0.15
0.10
0.05
0.00
-0.05
-0.10
-0.15
Output Amplitude (volt)
250
200
150
100
50
0
Time (msec)
(a)
Shaker: Thumper
Vertical static load ~ 2 tons
Hor. dynamic load ~ 0.25 ton; Exc. Freq: 50 Hz (8 cycles)
G12X
G8X
G5X
G2X
0.15
0.10
0.05
0.00
-0.05
-0.10
-0.15
Output Amplitude (volt)
250
200
150
100
50
0
Time (msec)
(b)
Shaker: Thumper
Vertical static load ~ 2 tons
Hor. dynamic load ~ 0.25 ton; Exc. Freq: 50 Hz (8 cycles)
G12Z
G8Z
G5Z
G2Z


