1652
Proceedings of the 18
th
International Conference on Soil Mechanics and Geotechnical Engineering, Paris 2013
Proceedings of the 18
th
International Conference on Soil Mechanics and Geotechnical Engineering, Paris 2013
retaining structure standard (2012), which now corresponds to a
performance based design method. Structures covered under
this new standard are shown in Figure 1. The revised standard
now offers a harmonized method covering both conventional
retaining structures and reinforced-soil structures.
1.2
1B
Problem with seismic design method in the previous
seismic standard
In the previous seismic standard (1999), one design method
applies to both conventional retaining walls and bridge
abutments. However, the dynamic response characteristics
differ during earthquakes in that the effect of seismic earth
pressure is greater than inertial force in the case of retaining
walls while for bridge abutments inertial force exerts the main
influence.
The method to obtain residual displacement for conventional
retaining walls and conventional bridge abutments according to
the previous seismic standard is shown in Figure 2. The load -
displacement relationship of a foundation and a wall is
calculated by static nonlinear analysis independently, and a
‘constant energy law’ is used to calculate the maximum
response displacement considering plastic behavior of them.
Verification of the performance of a foundation’s stability
and
residual deformation of wall members were evaluated with a
plastic ratio (ratio of maximum response displacement to
maximum linear response displacement).
Even though the ‘constant energy law’ offers the advantage
of being a simple calculation, it cannot take into account the
displacement characteristics of a retaining structure, which
tends to accumulate in a single direction (active direction), and
largely affected by seismic ground motion characteristics
(duration and number of seismic motions).
In view of the above, it is preferable to separate the design
methods for conventional retaining walls and bridge abutments
in order to consider the dynamic response characteristics and
the purpose of application of each structure.
In this study, therefore, a series of shaking table model tests
were performed in order to evaluate the dynamic response
characteristics of each structure. Based on the test results, a
seismic design method for retaining walls was proposed. This
paper shows the test results mainly of retaining wall.
Figure 2 Calculation of plastic ratio of retaining structure by
‘
constant
energy law
’
(R.T.R.I, 2000)
2 SHAKING TABLE TESTS ON THE RETAINING WALL
MODEL
2.1
2B
Model retaining wall and backfill
Model tests were performed using a shaking table at the
Railway Technical Research Institute. A rigid soil container
(length: 2050 mm, width: 600 mm, and height: 1400 mm) was
fixed to the table. A 530 mm-high and 938 N in weight gravity-
type RW model was used in this study. The geometric shape of
this model was fixed in reference to the standard shape of such
examples in Japan, which are about 5 m in height, and then
reducing the size to a scale of almost one-tenth. The backfill
model and subsoil model was made of air-dried Toyoura sand
(D
50
=0.23 mm, G
s
=2.648, e
max
=0.977 and e
min
= 0.609). The
sand layers were produced using a sand hopper and a constant
falling height. This method helped achieve an average relative
density of 90%. There was no subsoil model in front of the
base footing in order to simplify the model. Watanabe et
al.(2003) have summarized the details of the model preparation.
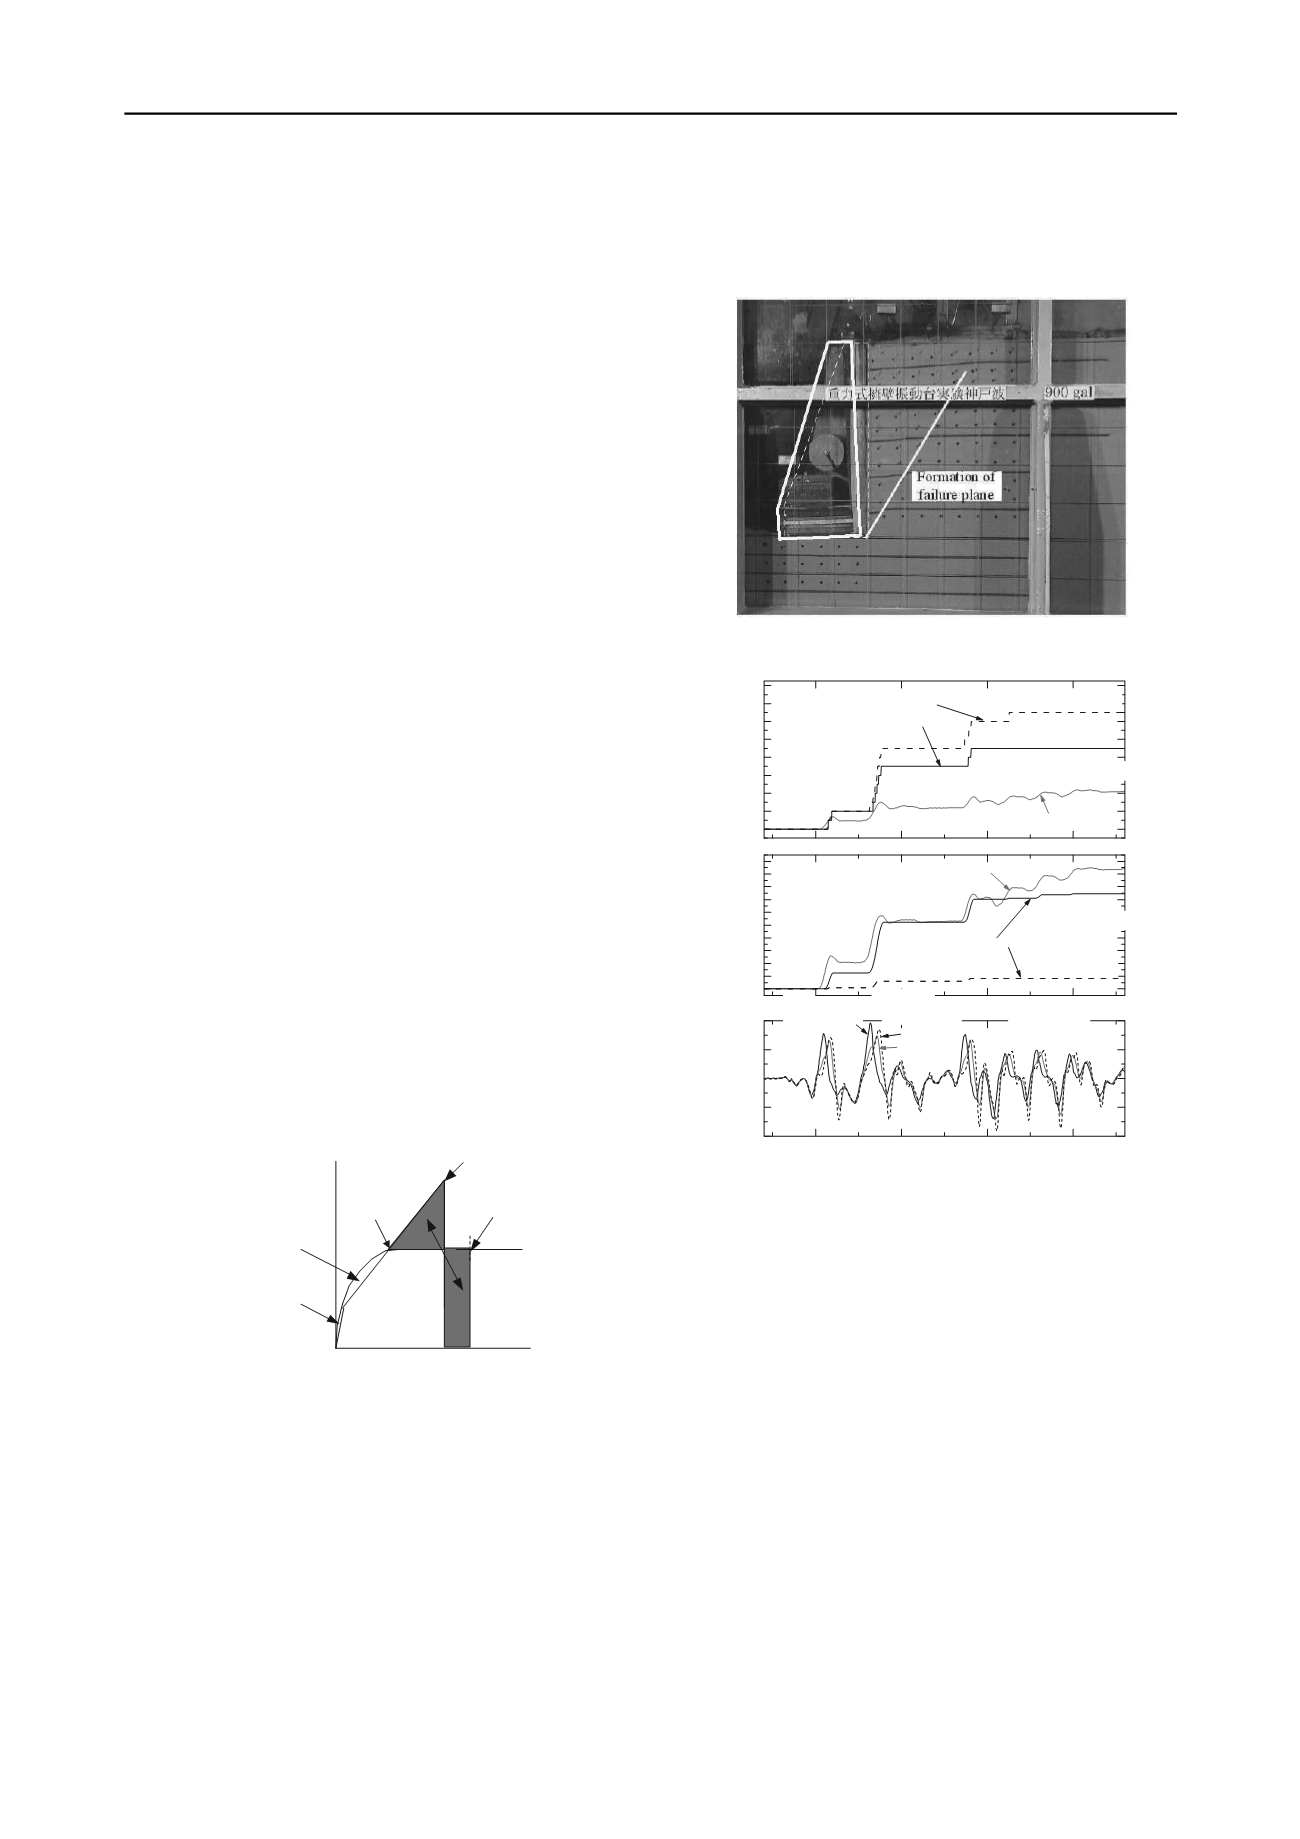
Figure 3 Residual displacement of retaining wall model and formation
of failure plane in the backfill soil
Figure 4 Time history of rotational angle, horizontal displacement and
acceleration
2.2
3B
Dynamic response characteristic of the retaining wall
Figure 3 shows the residual displacement of the wall and the
residual deformation of the backfill after shaking. The major
failure pattern was overturning, which was associated with the
bearing capacity failure of the subsoil. One inclined failure
plane was clearly observed in the backfill soil. This overturning
was mainly caused by the loss of bearing capacity near the toe
of base footing. This was confirmed by the output of 7 loadcells
which were arranged at the bottom of base footing. (Watanabe
et al. 2003). Horizontal displacement of the bottom end of the
retaining wall was 19mm and horizontal displacement of the top
end of the retaining wall was 36mm (rotational angle was
0.04rad) after shaking (Figure 4).
Figure 5a shows the relationship between overturning
moment being applied to a retaining wall by inertia force and
seismic earth pressure and response rotational angle of the
retaining wall. Figure 5b also shows the relationship between
horizontal external forces (inertial force and seismic earth
pressure) and horizontal displacement at the top of the retaining
wall. These figure shows clearly that the displacement is
accumulated rapidly around when the moment and external
External
force
equivalent
Second rotational spring
coefficient, Kr/30
Initial rotational spring
coefficient, Kr
Maximum linear
response point
Maximum response
point
Yield
point
displacement
5.5
6.0
6.5
7.0
1000
500
0
-500
-1000
(Outward Inertia)
Inward Acc.
backfill
walltop
acceleration
acceleration
↑
Acceleration(gal)
Time(sec)
0
2
4
6
8
10
12
14
16
18
20
overturning mode
sliding and
sliding mode
Measured displacement
Newmark method
Horizontal displacment
at the bottom(mm)
0.00
0.02
0.04
0.06
0.08
0.10
0.12
0.14
0.16
Response
Base
overturning mode
sliding and
overturing mode
Measured angle
Newmark
method
Response rotational
angle (rad)


