1645
Technical Committee 203 /
Comité technique 203
the category of soil with high compressibility in natural
conditions and very high in flooded conditions. M2-3 edometric
module and value of unit deformation under normal specific
effort level of 200kPa were considered for flooded samples.
In order to study the effect of treatment with (Portland) cement
for soft clay samples were also performed compression test-
settlement. Samples were treated with 8% and 12% cement
were tested in terms of site saturated with salt water after 6
days. An increase in the amount of edometric modulus M2-3
from 4.167 kPa to 5.262 kPa in mixed with 8% cement (20%
increase) and 6897 kPa mixed with 12 % cement (60%
increase). On samples from drilling were also conducted tests to
determine the shear strength parameters, both by direct shear
test and triaxial tests. In direct shear apparatus, saturated
samples were tested taking into account site conditions (nature-
soil and geological effort applied) being sheared in conditions
CU (consolidation effort geological area, v = 0.5mm/minut -
sheared undrained) and in CD conditions (geological
consolidation effort, v = 0.05m/minut - sheared drained).
On undisturbed samples belonging to the main geological
formations were performed following types of tests: - Type
direct shear tests consolidated - undrained (CU) and
consolidated-drained or type (CD); - Compressive load and
strain controlled triaxial stress conditions measured anisotropic
type CKoD and CKoU, respectively; - Triaxial compression
tests with strain imposed and effort to follow those measures
pore water pressure variation CKoU;
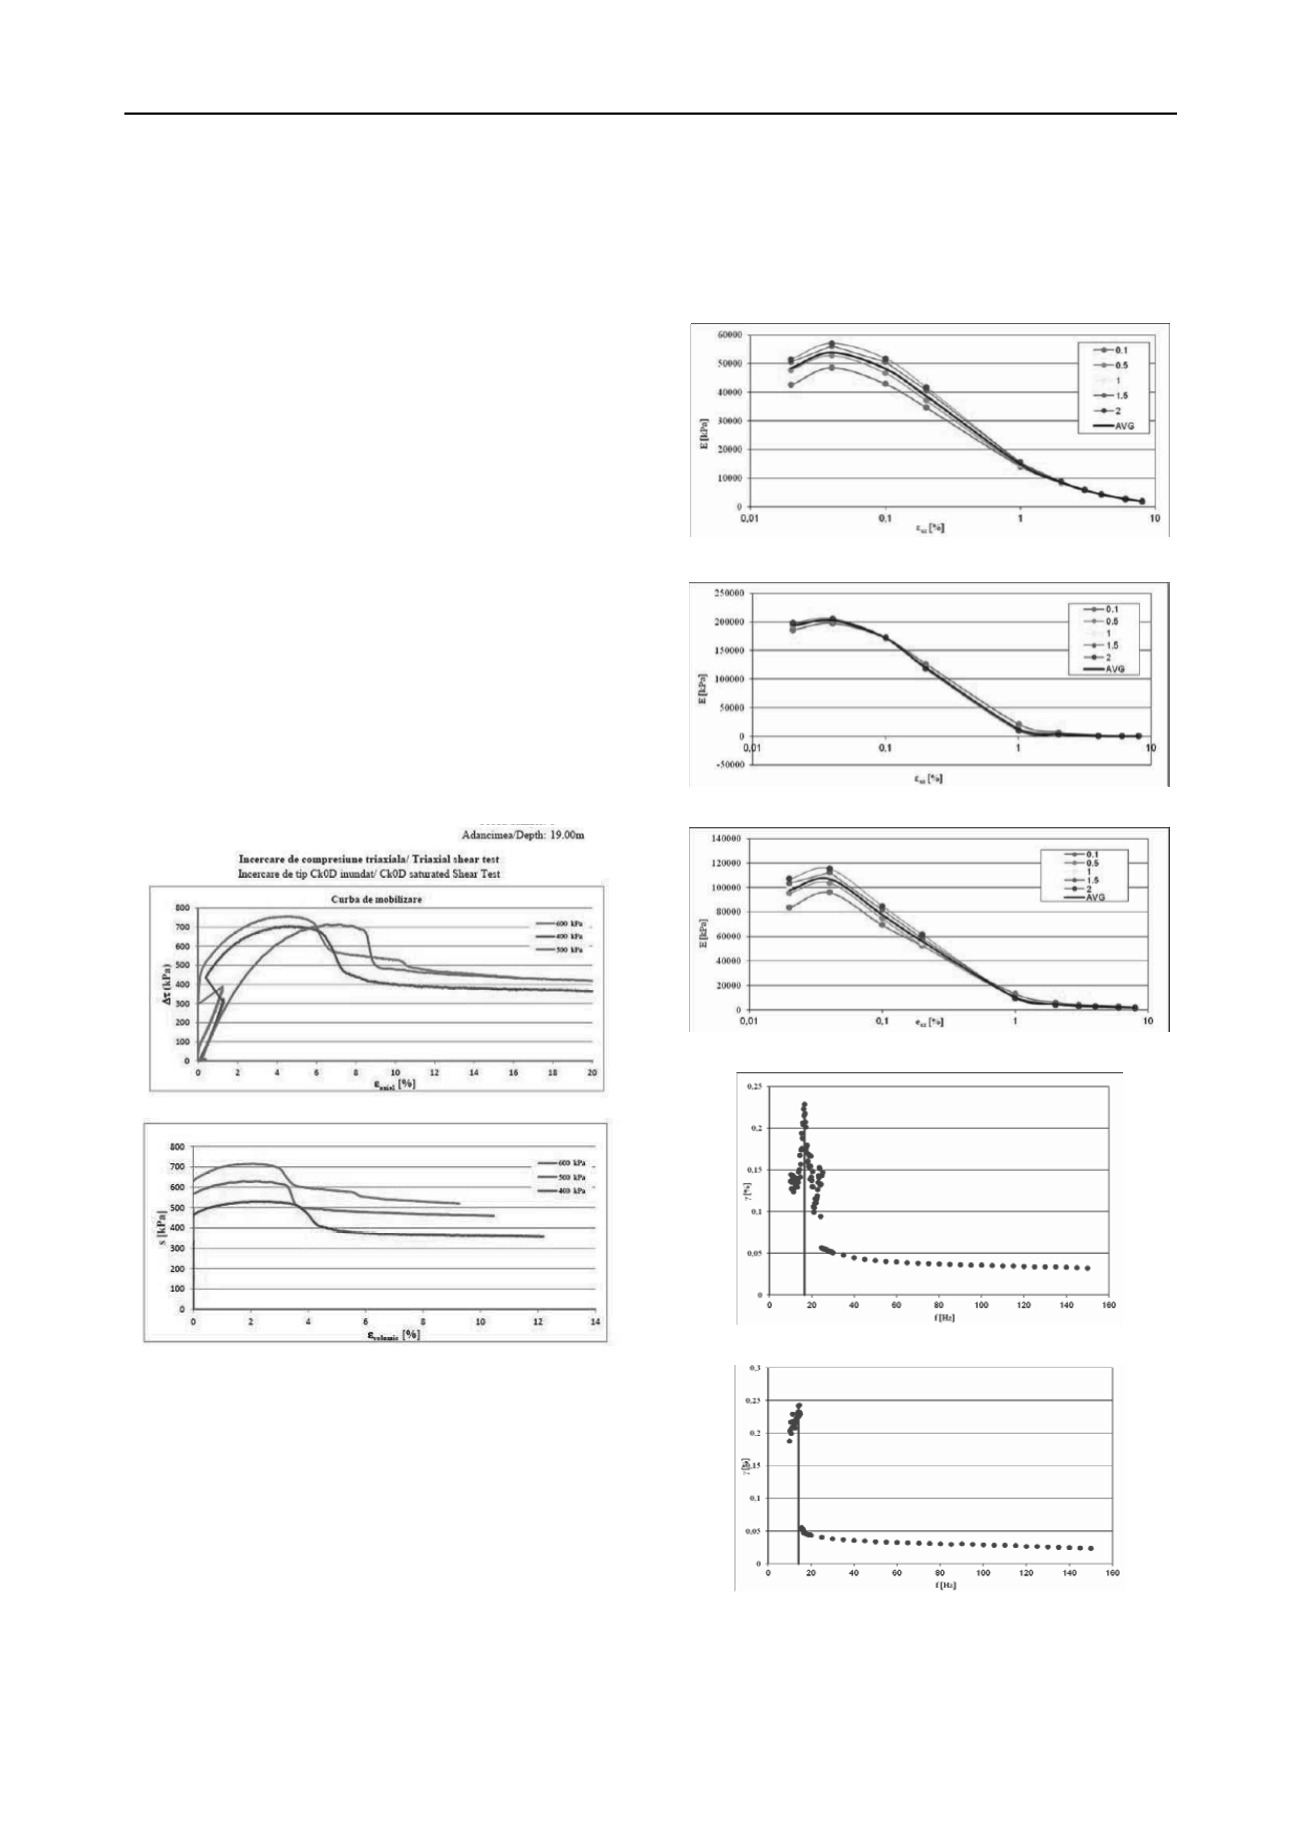
Are presented the stress-strain relationships recorded during
shear.
NISIP ARGILOS / CLAYEY SAND
Figure 9 Triaxial shear test CK0D - Δτ.
NISIP ARGILOS / CLAYEY SAND
Figure 10 Triaxial shear test CK0D - s.
From this analysis some conclusions can be drawn valid for
the entire site of the wind farm, namely:
- The mean experimental deformation module where a
degree of mobilization of shear strength of 60% are: E
n
= (10 ÷
11) x 10
3
kPa for clayey sands located at depths of over 20 m;
E
n
= (5 ÷ 6) x 10
3
kPa for clay dusts located at depths of over 10
m; E
n
= (6 ÷ 7) x 10
3
kPa for clays located at depths of over 10
m;
Graphic processing geotechnical data field and laboratory
investigation is shown in Figure - Correlation lithological
column highlighting the systematic sequence.
In cyclic triaxial test machine anisotropic samples were
consolidated on effort path k
0
. Each sample was tested as
follows: in the first stage from a vertical axial displacement
imposed to 0.01mm is determined dynamic modulus at different
frequencies from 0.5Hz to 2.0Hz, then for the other steps axial
displacement is changed from 0.02mm, 0.05mm, 0.1mm,
0.2mm, 0.5mm, 1.0mm, 1.5mm, 2.0mm, 3.0mm, 4.0mm, 6mm
and 8.0mm respectively, keeping the same type of frequencies.
Modulus of deformation values in linear dynamic conditions in
the analyzed frequency decreases greatly on clay samples
saturated soft with plastic strain values.
Figure 11 Mobilization curves for G-2, P6 – 15.0m (F2)
(G3, F3, 15m)
Figure 12 Mobilization curves for G-2, P9 – 22.0m
(F2; F3)
Figure 13 Mobilization curves for G-2, P10 – 25.0m (F2)
G-3, P18-25 (F3)
Figure 14 Resonant frequency for torsion is 16.6Hz for the sample silty
clay G-2, P06 – 15.0m; (F2); G-3 (F3)
Figure 15 Resonant frequency for flexure is 14.2Hz for the sample
clayey silt G-2, P06 – 15.0m, (F3; G3 – F3)
3. CONCLUSIONS
Given the physical and mechanical characteristics of the subsoil
in static and dynamic conditions as presented in the previous
chapters, 3 types of foundation is recommended for generator:


