1637
Technical Committee 203 /
Comité technique 203
‐0.8
‐0.6
‐0.4
‐0.2
0
0.2
0.4
0.6
0.8
0
5
10
15
20
25
30
0
0.5
1
1.5
2
2.5
0
0.5
1
1.5
2
2.5
3
a
(g)
t
(sec)
SA
(g)
T
(sec)
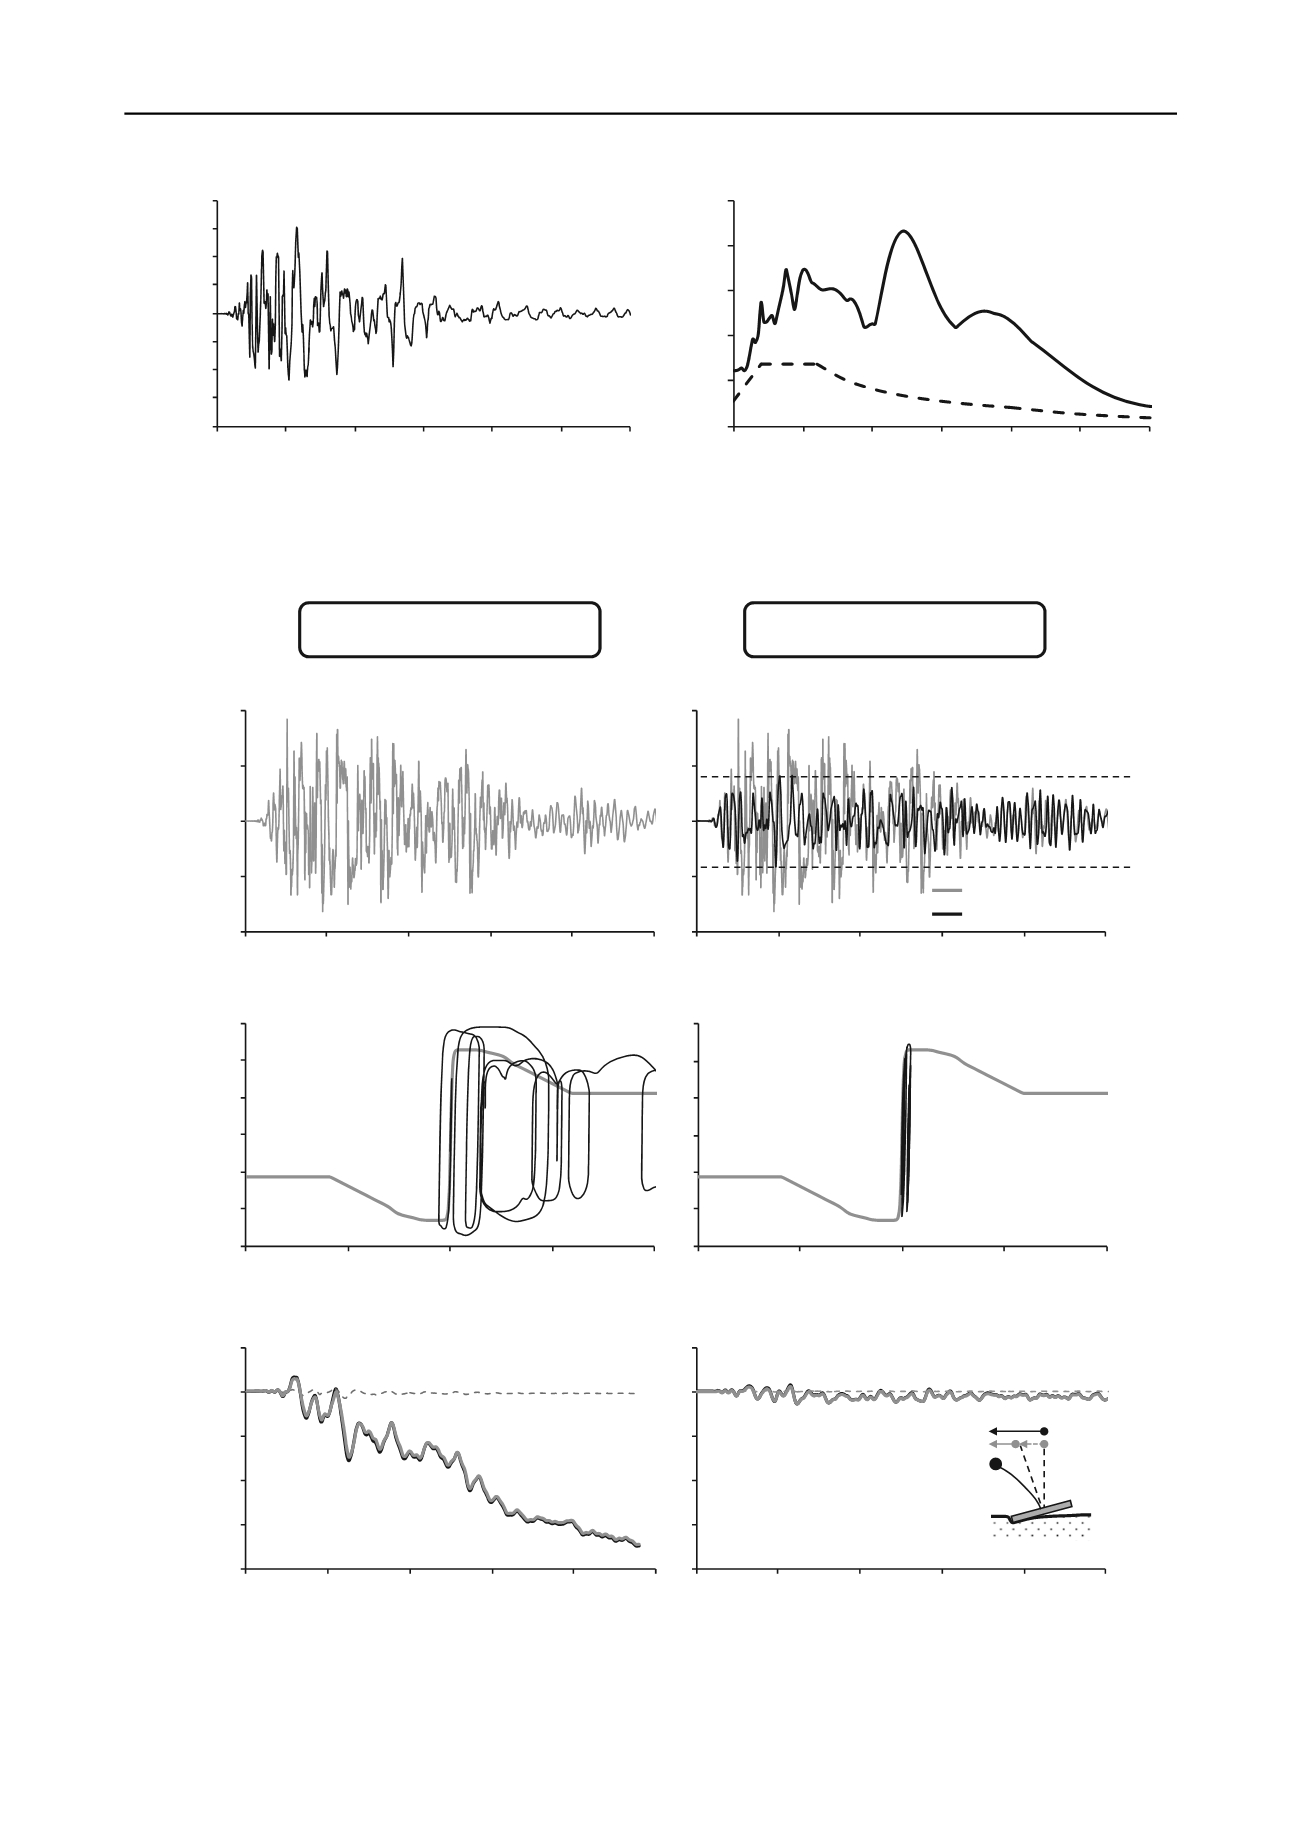
Figure 5. The Takatori record from the Kobe earthquake (Japan 1995) and its elastic response spectrum compared to the pier design spectrum.
‐1
‐0.5
0
0.5
1
0
5
10
15
20
25
‐1
‐0.5
0
0.5
1
0
5
10
15
20
25
non isolated free‐field
isolated embankment
Conventional design
In‐soil isolation
a
(g)
t
(sec)
t
(sec)
‐60
‐40
‐20
0
20
40
60
‐0.1
‐0.05
0
0.05
0.1
‐60
‐40
‐20
0
20
40
60
‐0.1
‐0.05
0
0.05
0.1
Μ
(MNm)
curvature
(1/m)
curvature
(1/m)
‐2
‐1.5
‐1
‐0.5
0
0.5
0
5
10
15
20
25
‐2
‐1.5
‐1
‐0.5
0
0.5
0
5
10
15
20
25
Δ
(m)
Δ
C
Δ
r
Δ
t
(sec)
t
(sec)
collapse
a
max
= 0.35g
Figure 6. Comparison of the two alternatives: conventionally designed pier response versus pier response with application of the in-soil isolation
system (a) Acceleration time histories at the base of the pier. (b) Moment – curvature response at the pier base and (c) time histories of deck drift Δ.


