1632
Proceedings of the 18
th
International Conference on Soil Mechanics and Geotechnical Engineering, Paris 2013
pore water generation), modulus degradation, and strength
softening of clays based on the following equation
s
max
max
c
max
c
G
1
G
(1)
Where G
max
is small strain shear modulus,
c
is the modulus
degradation index function and
is the stress softening index
function. Both indexes are coupled with the excess pore water
pressure and are dependent on the soil type.
and s are two
curve fitting parameters. For fine-grained clayey soil, the
modulus degradation and stress softening indices are equal and
can be correlated to the number of cycles as follows:
c
=
=
N
c
-
s (
-
t
)r
(2)
s and r are curve fitting parameters, which are correlated to clay
properties such as plasticity Index (PI) and overconsolidation
ratio (OCR), as listed in Table 1 based on comprehensive
laboratory test data (Vucetic and Dobry 1988). The threshold
shear strain amplitude
t
separates the domains of cyclic
softening development and essentially no softening
development. The corresponding cyclic softening model of
clays is depicted in Figure 1. After N
c
cycles, the clay exhibits
softening behavior including both strength softening (
max
)
and modulus degradation (
c
G
max
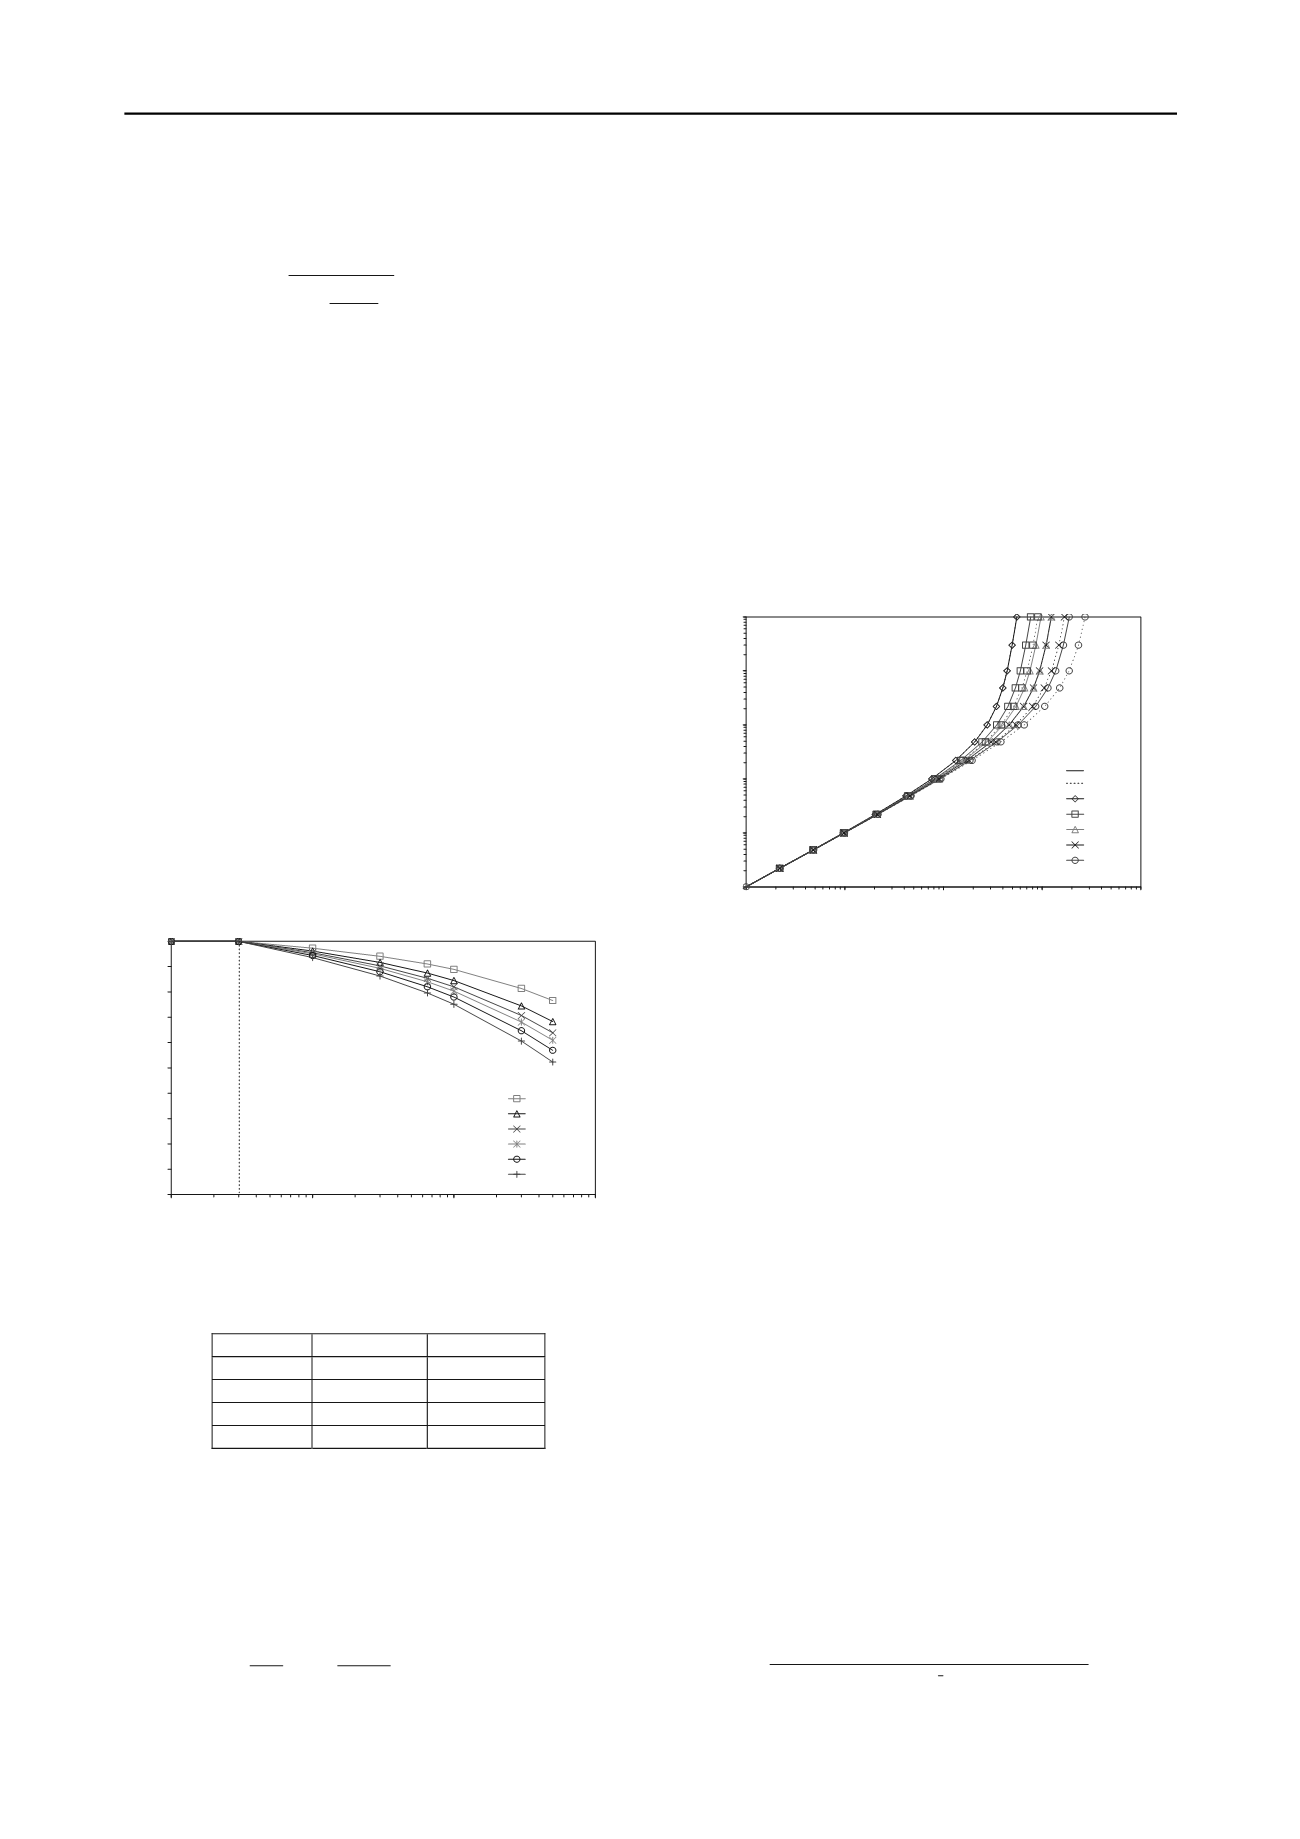
). Figure 2 presents an
example of strength softening after several numbers of cycles
with different cyclic strain amplitudes for a clayey soil with an
OCR of 1. To quantitatively estimate cyclic softening using the
stress softening index in Eq. (2), the equivalent amplitude of
cyclic strain and the corresponding number of cycles need to be
determined given an earthquake event.
Figure 2 Strength softening versus cyclic strain and number of cycles
Table 1. Model parameters of cyclic softening (Vucetic and Dobry
1988)
OCR
s
r
1
0.075
0.495
1.4
0.064
0.520
2
0.054
0.480
4
0.042
0.423
3 EFFECTIVE CYCLIC STRAIN
An equivalent amplitude of cyclic shear strain is used by
Tokimatsu and Seed (1987) to estimate the seismically-induced
volumetric change of unsaturated cohesionless soils. The
effective shear strain
eff
is estimated from
eff
using the
effective shear modulus (G
eff
) as follows:
d
eff
eff
r
Gg
PGA
G
G
0
max
max
65.0
(3)
where
PGA
is the ground surface peak ground acceleration
, g
=
the acceleration of gravity and
o
= the total overburden
pressure at depth
h
, and
r
d
is a stress reduction factor. The
product
eff
(G
eff
/G
max
)
in Eq. (3) can be readily translated to a
shear strain amplitude
eff
using published models for soil
modulus reduction with increasing shear strain (i.e. models
relating
eff
to
G
eff
/G
max
).
The modulus reduction curve may be selected from
published models based on soil index properties. Darendeli and
Stokoe (2001) proposed a family of modulus reduction curves
based on a large suite of test results considering the effects of
effective stress (
’
), soil plasticity (as represented by PI), and
OCR. Figure 3 shows a family of modulus reduction curves
(based on the Darendeli and Stokoe model) for varying PI and
OCR and for
v
’=1 atm. Note that the plots in Figure 3 are
formatted to directly estimate shear strain
from the product
(G/G
max
). Once the product
(G/G
max
) is calculated using Eq (3),
effective cyclic strain can be directly determined from Figure 3.
1.00E-04
1.00E-03
1.00E-02
1.00E-01
1.00E+00
1.00E+01
1.00E-06
1.00E-05
1.00E-04
1.00E-03
1.00E-02
G/Gmax
(%)
PI=0
PI=15
PI=30
PI=50
PI=100
OCR=1
OCR=5
Figure 3 Modulus reduction curves from Darendeli and Stokoe (2001)
re-expressed in the format for estimation of shear strain amplitude
0
0.1
0.2
0.3
0.4
0.5
0.6
0.7
0.8
0.9
1
0.01
0.1
1
10
Cyclic strain (%)
Shear strength softening (
c
max
/
max
)
Nc=5
Nc=10
Nc=15
Nc=20
Nc=30
Nc=50
t=0.03%
4 EQUIVALENT NUMBER OF UNIFORM STRAIN
CYCLES (
N
C
)
Using a strong motion data set from tectonically active regions,
Liu et al. (2001) developed empirical regression equations to
evaluate the equivalent number of uniform stress cycles of
earthquake shaking as a function of magnitude (M
w
), site-source
distance, site condition, and near-fault rupture directivity
effects. The
N
c
values were derived based on weighting factors
specific to the evaluation of soil liquefaction triggering and a
linear relationship between cyclic resistance ratio (CRR) and
N
c
in log-log space is established from laboratory tests;
b
c
Na CRR
(4)
where a and b depend on soil type and b stands for the relative
contribution of cycles with different amplitudes to the failure.
Typically, b ranges from 0.1 to 0.5 representing clay to sand
with respect to liquefaction triggering. With regard to cyclic
softening of clay, b is approximately one given different
strength softening conditions, as shown in Figure 4, where the
vertical axis represents cyclic strain instead of CRR. Therefore,
Liu et al.’s empirical regression equations are not applicable for
the case of cyclic softening because the weighting factors are
different due to different b values and, consequently, estimated
N
c
is diverse.
Kishida and Tsai (2012) proposed an empirical equation that
can consider different b values for estimating
N
c
as follows:
b
s
w
c
bTcb c Mc S c PGA c c
N
1
5
4
3 1
2
1 0
65.0
5.0
ln
ln
ln
exp ln
ln
(5)


