1625
Technical Committee 203 /
Comité technique 203
0
100
200
300
400
500
600
Vertical position (mm)
-1200
CASE1 : No improvement
■ :
Inclinometer
Initial surface
Subsidence
-1000 -800 -600 -400 -200 0 200 400 600 800 1000 1200
Holizontal position (mm)
Uplift
lateral deformation by connecting them to a 5 mm-thick plastic
boards. By assuming the scale ratio of 1/20, the prototype
diameter of the columns is 520 mm. The range of soil
improvement (shown by orange color in Fig. 5) is 600 mm in
length and 390 mm in width with the improvement ratio of 25%.
200
380
40
40
40 40
40
45 45 45 45
50
0
100
200
300
400
500
600
Vertical position (mm)
-1200
CASE2 : Irregular 25%
■ :
Inclinometer
Improved area Initial surface Subsidence
-1000 -800 -600 -400 -200 0 200 400 600 800 1000 1200
Holizontal position (mm)
Uplift
0
100
200
300
400
500
600
Vertical position (mm)
-1200
CASE4 : Regular 25%
■ :
Inclinometer
Initial surface Subsidence
Improved area
-1000 -800 -600 -400 -200 0 200 400 600 800 1000 1200
Holizontal position (mm)
0
20
40
60
80
100
120
140
160
0
20
40
60
80
100
120
140
160
Lateral displacement (mm)
-1200
△
:CASE1(No improvement)
●
:CASE2(Irregular 25%)
□
:CASE4(Regular 25%)
-1000-800 -600 -400 -200 0 200 400 600 800 1000 1200
Holizontal position (mm)
Lateral displacement (mm)
-1200
△
:CASE1(No improvement)
●
:CASE3(Irregular 35%)
□
:CASE5(Regular 35%)
-1000-800 -600 -400 -200 0 200 400 600 800 1000 1200
Holizontal position (mm)
Improved area
Improved area
Water
Compacted sand (Non-liquefied layer)
D
r
= 85 %
100 400
Loose sand (Liquefied layer)
D
r
= 40%
(mm)
Anchorage
600
Quay wall
Improved area
2650
390
Accelerometer
Pore water pressure transducer
Displacement transducer
A1 A2
A3
P1
P4 P7
P10
P2
P5 P8
P11
P3
P6 P9
P12
Table 2. Similitude law for 1-G model tests
Items
Model/Prototype
Prototype
Model
Scale(N=20)
1/N
1
0.05
Pile diameter
1/N
520mm
26mm
Frequency
N
-0.75
1.06Hz
10Hz
Relative density
60% 40%
Acceleration
1
200Gal
200Gal
Figure 5. Schematic view of quay wall model
Figure 6. Vertical shape of anchorage plate (connected with quay wall at
top left and right by rods; see white circles there)
Table 3. Details of quay wall model
Test case
CASE6
CASE7
CASE8
Configuration of
columns
-
Irregular
Regularly
triangular
Improvement ratio
(%)
0
25
25
Maximum
acceleration (Gal)
200, 500
The sheet-pile quay wall was modeled by an aluminum plate
having 3 mm thickness and 510 mm height with its width equal
to that of the soil box. The bottom of the wall was placed in a
socket at the bottom and had no mechanical fixing. This wall
was supported by an anchorage.
Accelerometers and pore pressure transducers were
embedded in the model ground, while acceleration and
displacement at the top of the sheet pile wall were recorded as
well (Fig. 5). Further, motion picture was taken of the lateral
cross section of the ground in which lines of colored sand was
installed for easy interpretation.
The base shaking is identical with the one in Fig. 4 with the
maximum acceleration of either 200 or 500 Gal. For details of 3
tests run, see Table 3. Both regular (triangular) and irregular
configurations of columns were tested with the improvement
ratio of 25 %.
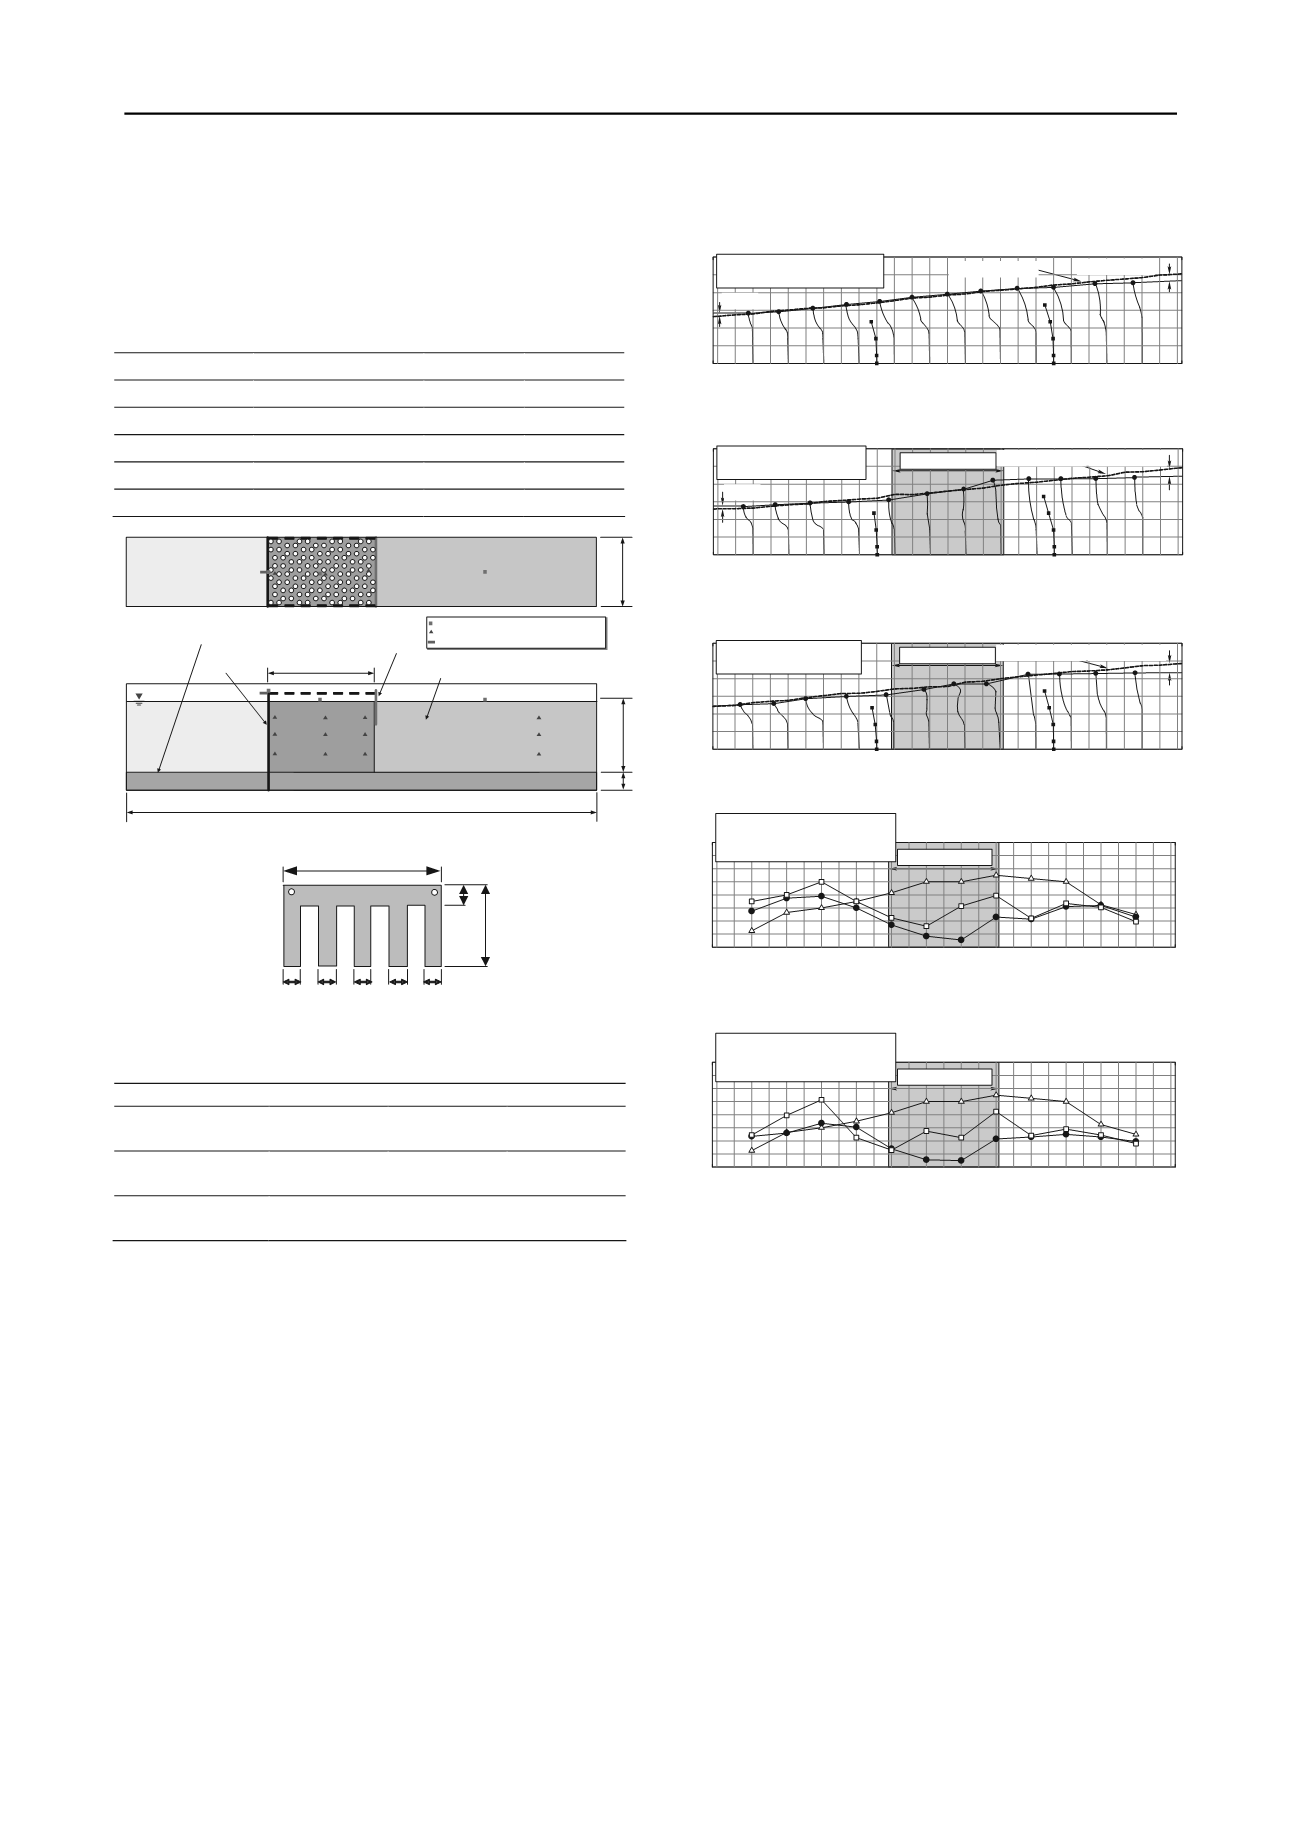
4 RESULTS OF SLOPING GROUND MODEL
Deformations of testes models are illustrated in Figs. 7-9. While
deformation of vertical columns of colored sand in contact with
the side window is shown by black lines, the inclinometer data
in the central part of the mode is indicated by black dots. First,
the deformation of ground without columnar improvement
Figure 7. Deformation of sloping ground model of Case1
Figure 8. Deformation of sloping ground model of Case2
Figure 9. Deformation of sloping ground model of Case4
Figure 10. Lateral displacement at the surface at the end of shaking
(improvement ratio 25%)
Figure 11. Lateral displacement at the surface at the end of shaking
(improvement ratio 35%)
(Case 1) shows that the most part of deformation occurred in the
upper liquefied layer, while the deformation in the unliquefiable
base layer is insignificant. The higher upstream side subsided
and the lower downstream side uplifted, consequently reducing
the slope gradient. Second, the Case 2 test with the irregular
column configuration developed uplift in the upstream
proximity of the improved area (+200 to +500 mm) probably
because the columns reduced and dammed the lateral flow of
liquefied sand. This finding is a good contrast with the
deformation of Case 4 (triangular configuration) where the
lateral flow of liquefied sand was easier. Similar difference was
observed in the cases of 35% improvement ratio as well.
Figures 10 and 11 compare the lateral displacement at the
top (at the surface) of colored sand as indicated by black dots
(inclinometers) in Figs. 7 to 9. It is first found that cases with
any kind of column configuration (Case 2 to 5) was of less
extent of displacement than in Case 1 without columns. Thus,
columns mitigate the lateral displacement of liquefied subsoil.
Further, the cases with the irregular configuration (Cases 2 and
3) showed the displacement even smaller than in the cases of
triangular configuration (Cases 4 and 5). Thus the mitigative


