1621
Technical Committee 203 /
Comité technique 203
Fluid, which was made 50 times viscous by methylcellulose,
was used as pore water to fit time scaling between dynamic
behaviour and dissipation of excess pore water pressure in a
centrifuge. In Series A, CO
2
gas was percolated and deaired,
followed by the percolation of viscous fluid in a gravitational
field. In Series B, viscous fluid was percolated into the model
ground in a centrifuge without CO
2
and deairing. This
percolation method was proposed by Okamura & Inoue (2012),
and it could make sandy ground saturated by reducing
unsaturated zone during percolation with the help of the
centrifugal acceleration.
After preparing tested model, shaking tests were conducted
by using the centrifuge facility Mark II owned by the Port and
Airport Research Institute. The details of the facility can be seen
in the report by Kitazume & Miyajima (1995). Moreover, the
validity of a dynamic centrifuge model test on ground
liquefaction inside grids was shown by Takahashi
et al
. (2006b,
2006c). In these reports, the modelling of models method was
used to assess the validity of a centrifuge test.
In Series A, the input signal for shaking was 50 sine waves,
which had the frequency of 100 Hz. 100 Hz corresponds to 2 Hz
in a proto-type scale. In the meanwhile, the input signal of
Series B was irregular wave simulating huge Level-2
earthquake. In both series, the acceleration level was increased
stepwise, keeping the wave shape. Response acceleration,
excess pore water pressure, and settlement of model ground
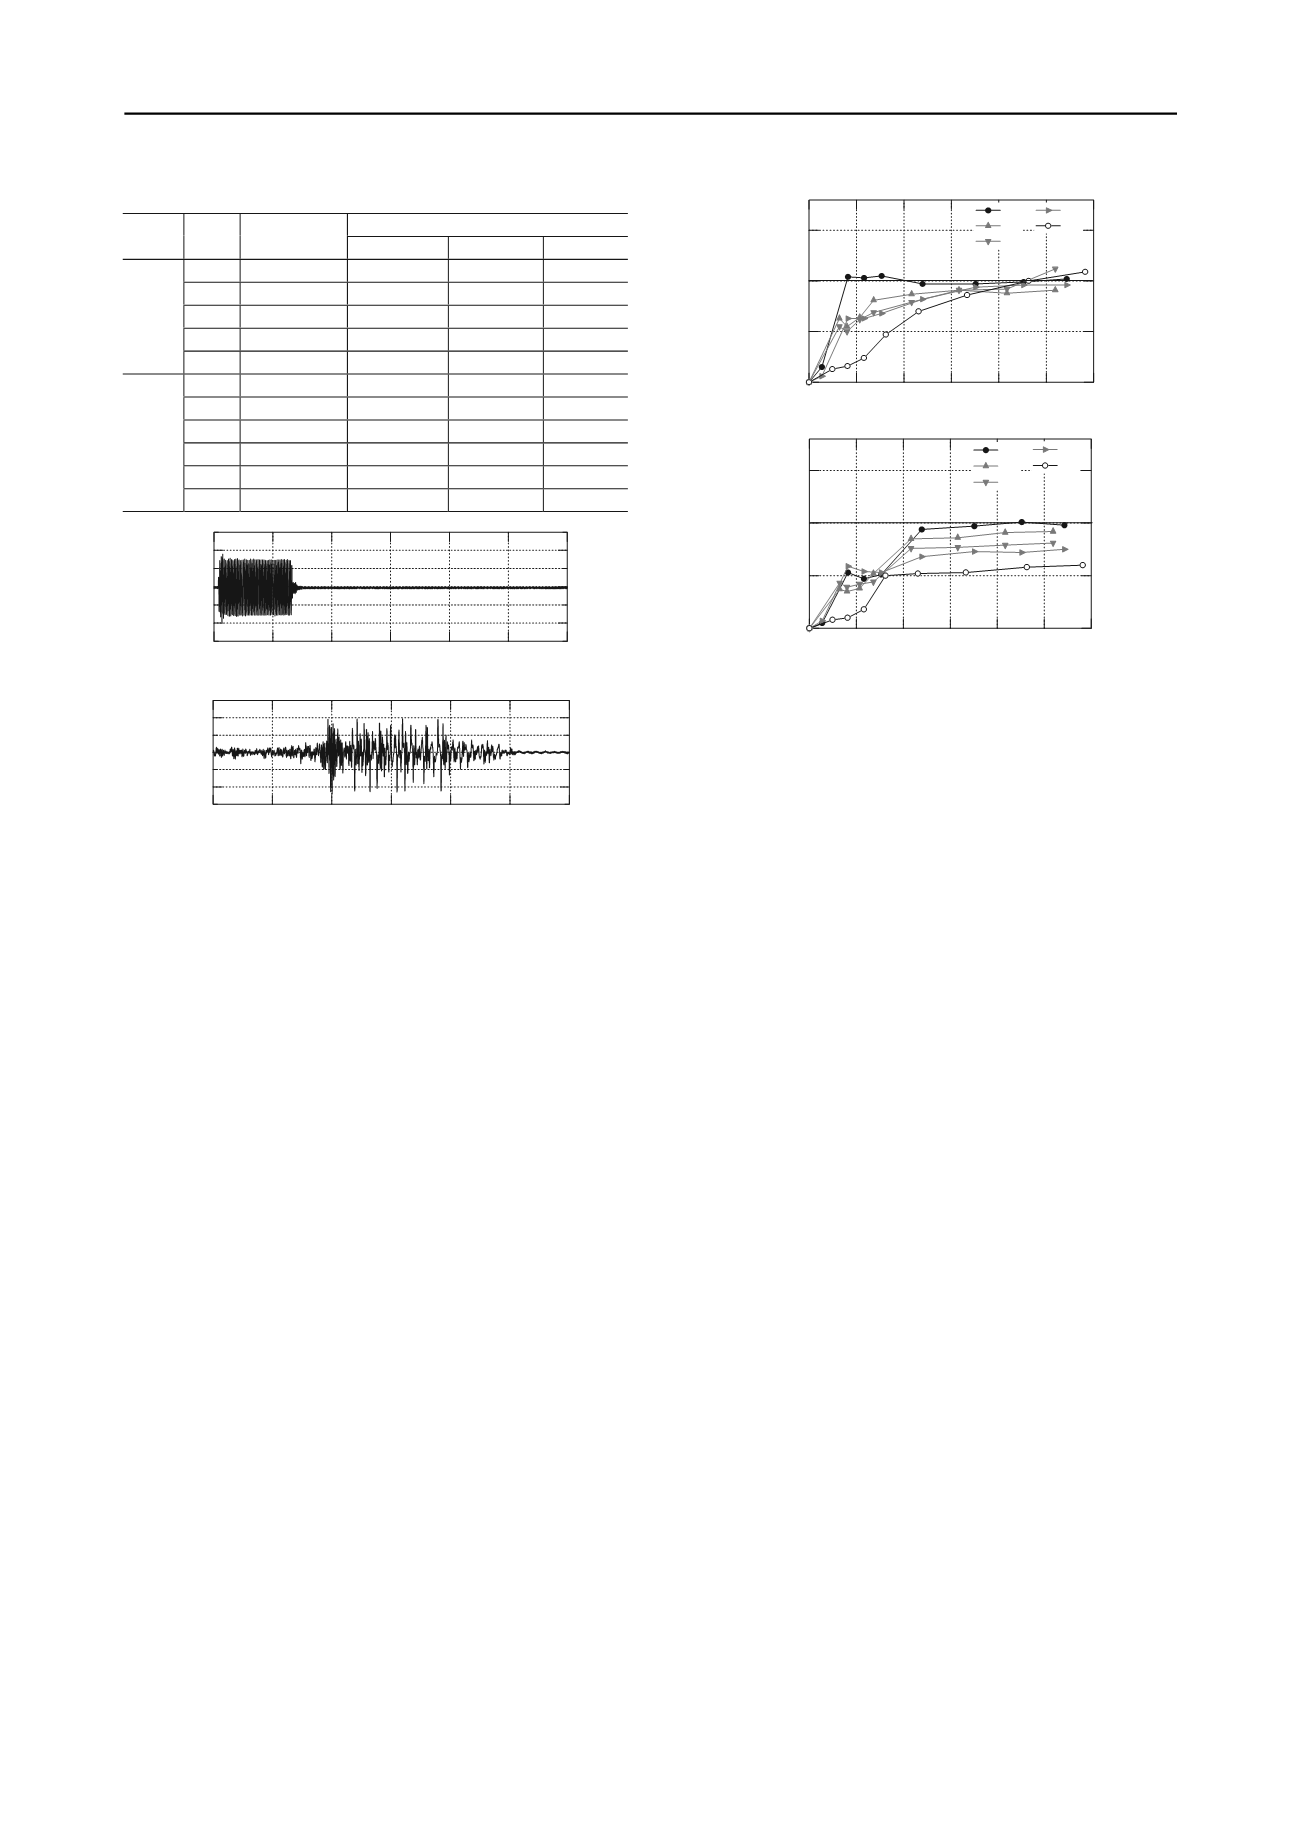
were measured during the shaking. The examples of response
acceleration measured at the bottom of the specimen box in
Cases A1, A4, and B1 are shown in Fig. 6.
3.2
Test results of Series A
This section discussed the test results of Series A. Figure 7
shows the relationship between the input acceleration and the
maximum value of excess pore water pressure, (
u/
’
)
max
, in a
proto-type scale. As
u/
’
fluctuated during the shaking, the
middle value of fluctuating
u/
’
is chosen as (
u/
’
)
max
.
Figures 8(a) and (b) represent the values at the depth of 2.6 m
(Pwp1 in Fig. 5) and 10.0 m (Pwp2 in Fig. 5), respectively.
As shown in Fig. 7(a), (
u/
’
)
max
of A1 increased to 1.0 even
below the input acceleration level of 1.0 m/s
2
. This means that a
shallow layer in unimproved ground such as Case A1 could
easily liquefy by a relatively weak earthquake. On the other
hand, (
u/
’
)
max
of A2 ~ A4, in which only the shallow layer
was improved, were below 0.7, and thus the floating-type
improvement took effect in the shallow layer. (
u/
’
)
max
of A5
was at a lower level of 0.2, and the effect of the ground
improvement was the largest in A2 ~ A5. Additionally, the
acceleration level when (
u/
’
)
max
was 1.0 was over 4.0 m/s
2
in
A2 ~A4, and this level was corresponding to the level of A5.
In Fig. 7(b), (
u/
’
)
max
of A1 and A2 ~ A4 did not have a
clear difference below the input acceleration level of 2.0 m/s
2
,
but those differed above the level of 2.0 m/s
2
. To be more
specific, (
u/
’
)
max
of A1 remained stable around 1.0 above the
input of 2.0 m/s
2
, and those of A2 ~ A4 did around 0.7 ~ 0.9.
The deeper improvement made (
u/
’
)
max
lower. (
u/
’
)
max
of
A5 stayed constant around 0.5 ~ 0.6. According to these results,
the floating-type improvement took effect, restricting excess
pore water pressure at both shallow and deep layers. In addition,
the improvement effect became larger by deepening the
improvement depth of the floating-type treated soil.
3.3
Test results of Series B
3.3.1
Properties of pore water pressure
This sub-section discussed the properties of pore water pressure
measured. Time histories of excess pore water pressure ratio,
u/
’
, are shown in Fig. 8 in a proto-type scale. Each figure
shows the ratios at the depth of 3.5 m (Pwp1 in Fig. 5) and 7.0
m (Pwp2 in Fig. 5) in B1, B2, and B4. The input acceleration
level was around 1.97 m/s
2
.
As shown in Fig. 8(a),
u/
’
at the depth of 3.5 m in B1, the
unimprovement case, sharply increased to 1.0, and the ground
was liquefied shortly after subjected to the principal motion.
Furthermore,
u/
’
slowly decreased after the principal motion,
and this meant that the ground was fully liquefied.
u/
’
at the
depth of 7.0 m also increased to 1.0 by the principal motion and
slowly decreased after that. These properties indicated that the
ground was liquefied throughout the liquefiable layer.
On the other hand,
u/
’
in B2, the fixed-type improvement
case, did not reach 1.0, but approached 0.9 by the principal
motion. It should be noted that
u/
’
promptly decreased after
Table 2. List of model test cases
Depth of treated soil
Series
Case
Type
Left
Center
Right
A1
Unimproved
-
0.0 m
-
A2
Floating-type
-
5.0 m
-
A3
Floating-type
-
7.5 m
-
A4
Floating-type
-
10.0 m
-
A
A5
Fixed-type
-
12.5 m
-
B1 Unimproved
0.0 m
0.0 m
0.0 m
B2
Fixed-type
8.0 m
8.0 m
8.0 m
B3 Floating-type
8.0 m
4.0 m
8.0 m
B4 Floating-type
8.0 m
6.0 m
8.0 m
B5 Floating-type
0.0 m
4.0 m
8.0 m
B
B6 Floating-type
8.0 m
2.0 m
8.0 m
1.5
1.0
0.5
0.0
Maximum E.P.W.P. (
u/
'
)
max
6 5 4 3 2 1 0
Acceleration (m/s
2
)
A1
A2
A3
A4
A5
1.5
1.0
0.5
0.0
Maximum E.P.W.P. (
u/
'
)
max
6 5 4 3 2 1 0
Acceleration (m/s
2
)
A1
A2
A3
A4
A5
Figure 7. Maximum excess pore water pressure: upper; depth of 2.6 m
at Pwp1, lower; depth of 10.0 m at Pwp2
-2
0
2
Acceleration (m/s
2
)
120
100
80
60
40
20
0
Time (sec)
-2
0
2
Acceleration (m/s
2
)
120
100
80
60
40
20
0
Time (sec)
Figure 6. Measured acceleration of ground: upper; Series A (A1&A4),
lower; Series B (B1)


