1613
Technical Committee 203 /
Comité technique 203
3.2
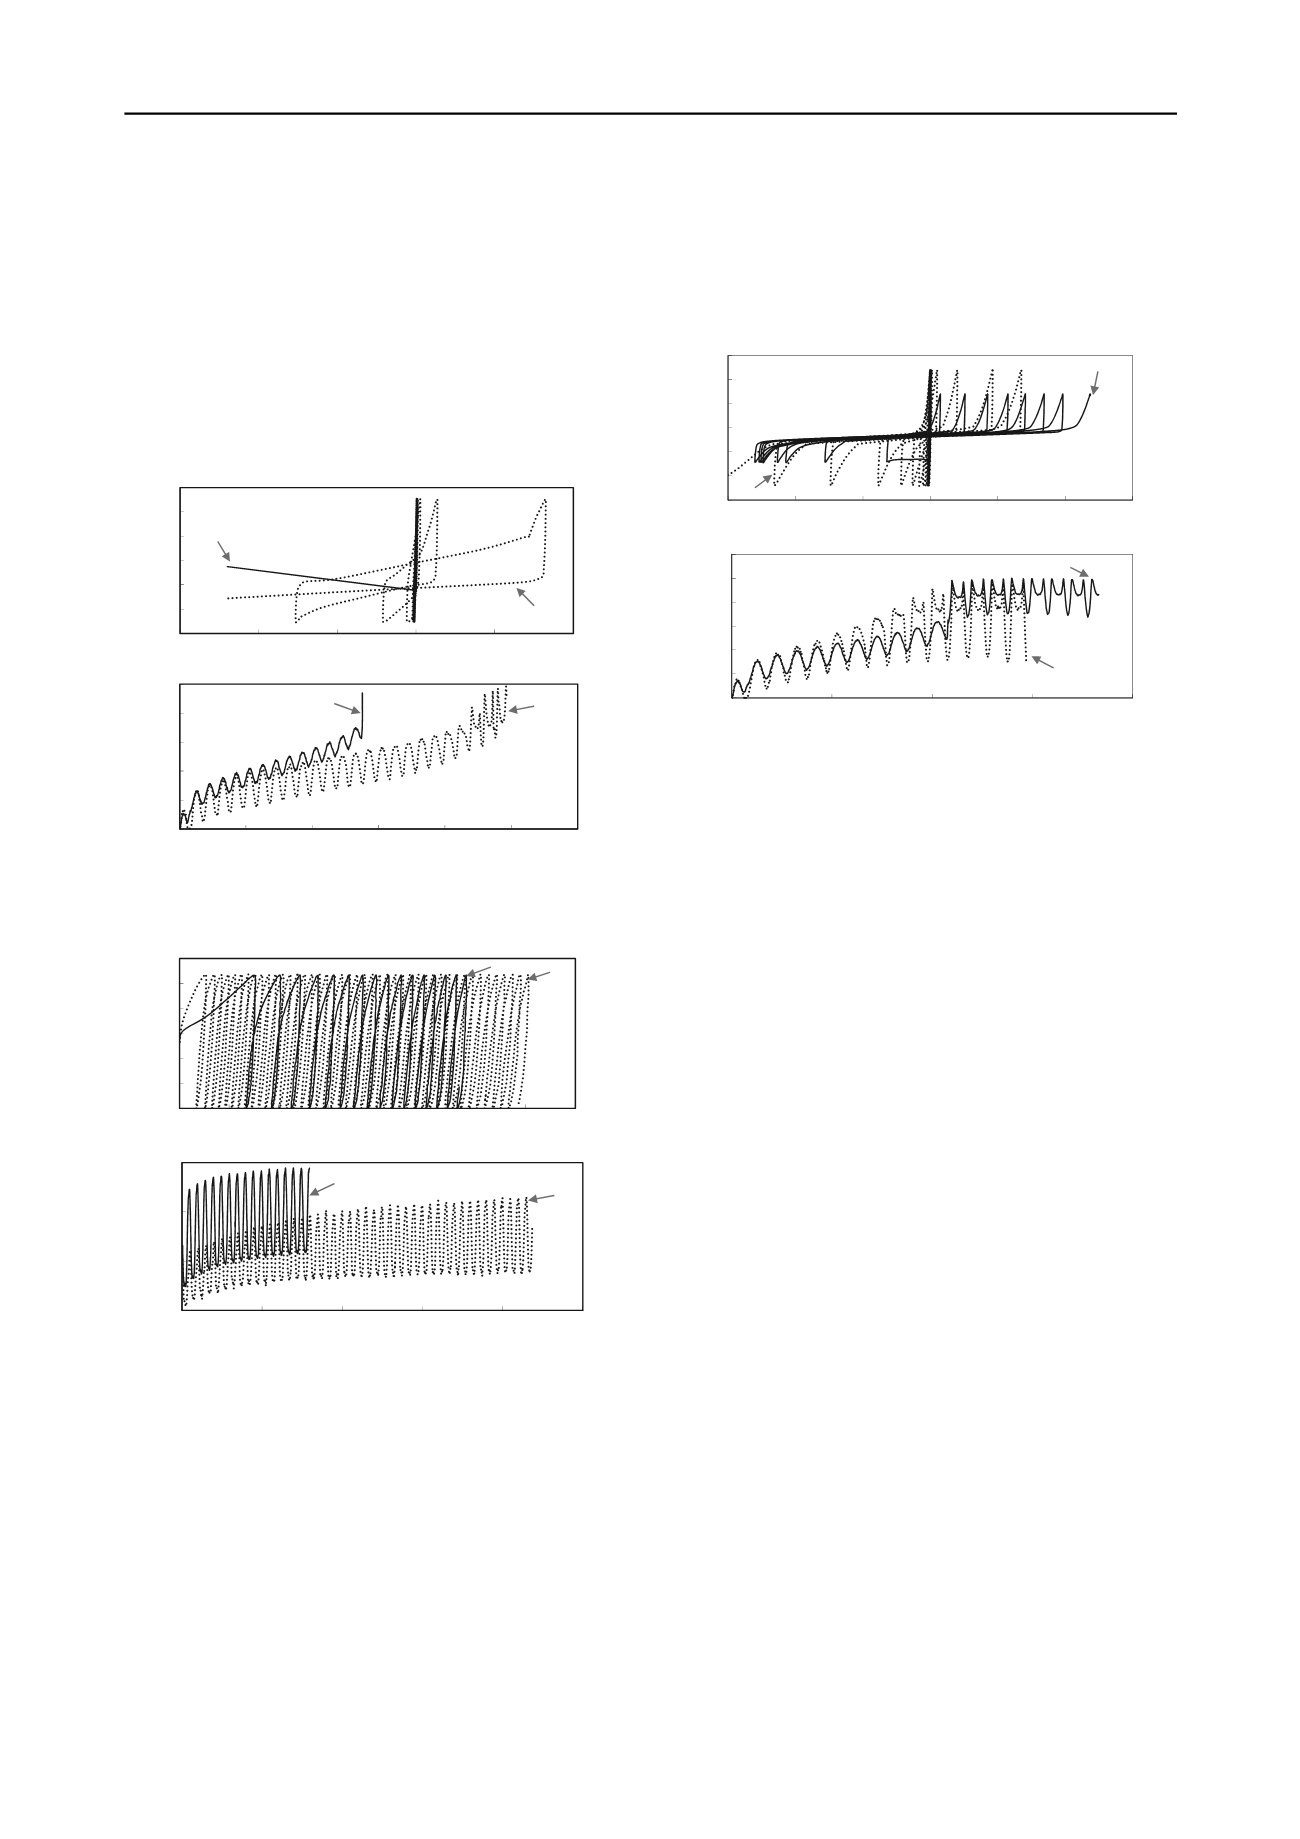
Cyclic Mobility (MT) vs Runaway Deformation (DD)
A remarkable change in MT behavior is observed as soon as the
soil density reaches D
rc
= 35%. Cyclic mobility prevails in its
failure mode when
= 0. Under otherwise identical condition,
DD specimen is still liable to complete collapse i.e. runaway
deformation. It is illustrated in Figure 3.
Here, cyclic mobility is featured by the progressive excess
PWP build-up which eventually leads to transient softening of
soil whenever the applied deviatoric stress reaches zero. When
it is non-zero, the sand gains back strength and stiffness as a
result of the temporary PWP reduction. Yet, once softening is
first triggered, the associated deformation becomes excessive
and keeps accumulating in double-amplitude.
Figure 3. Cyclic mobility (MT) & runaway deformation (DD):
[D
rc
=35%,
nc
’=100kPa,
=0, CSR
n
=0.225(MT),0.125(DD)]
Figure 4. Plastic strain accumulation in single amplitude (MT & DD):
[D
rc
=35%,
nc
’=100kPa,
=0.4, CSR
n
=0.4]
3.3
Plastic Strain Accumulation (MT & DD)
By simply imposing initial shear stress (
= 0.4) to the test
conditions presented in Section 3.2, the failure mode is abruptly
changed into plastic strain accumulation in single-amplitude for
both fabric types but obviously the rate of strain gain is different
(Figure 4).
3.4
Cyclic Mobility (MT) vs Limited Deformation (DD)
The fabric effect has been observed remarkable at loose state. It
is, therefore, of interest to explore how it might change at a
denser state. A single series of tests has thus been conducted:
D
rc
= 50%,
nc
’ = 100kPa and
= 0 (Figure 5).
At such condition, another form of limited deformation is
observed, again, only in DD behavior. Instead of being followed
by a high pace of plastic strain accumulation, the partial
collapse is succeeded by cyclic mobility. This failure mode is
clearly different from the pure mobility exhibited by the MT
specimen. Sudden and abrupt deformation and PWP build-up to
the state of transient softening are triggered in the course of
cyclic load application on the DD specimen. That on MT
specimen is, on the other hand, progressive and controlled.
-75
-50
-25
0
25
50
75
-15
-10
-5
0
5
10
15
Deviatoric stress (kPa)
Axial strain (%)
.
MT
DD
-60
-40
-20
0
20
40
60
-15
-10
-5
0
5
10
Deviatoric stress (kPa)
Axial strain (%)
MT
DD
0
20
40
60
80
100
120
0
5
10
15
20
Excess PWP (kPa)
Loading cycles
MT
DD
0
20
40
60
80
100
0
5
10
15
20
25
30
Excess PWP (kPa)
Loading cycles
MT
DD
Figure 5. Cyclic mobility (MT) & limited deformation (DD):
[D
rc
=50%,
nc
’=100kPa,
=0, CSR
n
=0.25(MT),0.175(DD)]
4 MICROSCOPIC INTERPRETATION
It is attempted to offer an explanation to the above macroscopic
observations from a microscopic perspective on a qualitative
basis. It has been consistently observed that: 1) limited
deformation prevails in DD behavior only; 2) DD and MT
behaviors are distinctive only when
presents at loose state but
when
is absent at dense state; and 3) both DD-induced excess
PWP build-up pace and axial deformation rate are higher.
0
30
60
90
120
150
180
0
1
2
3
4
5
6
7
Deviatoric stress (kPa)
Axial strain (%)
MT
DD
8
4.1
Degree of Anisotropy
Following the pioneering works by Oda (1972a), it is generally
accepted that dry sand when deposited under gravity would
have the contact normals aligning preferentially along the
deposition direction because the particles tend to stop at the
most stable position. This features the high degree of anisotropy
induced in the DD specimen. On the contrary, initial moisture
contributes suction which holds particles of MT specimen
together. The orientation of grains is thus not controlled by
gravity. Such random particle orientation results in a more
isotropic structure, which is similar to the honeycomb structure
suggested by Casagrande (1975). Figure 6 hypothetically shows
these two distinct fabric structures. This difference in anisotropy
is consistent with the quantitative study by Yang et al. (2008)
who computed the average vector magnitude
of DD sample
as 0.214, whereas that of MT is 0.091.
= 0 indicates isotropy.
-20
0
20
40
0
10
20
30
40
Excess PWP (kPa)
Loading cycles
MT
DD
50


