1605
Technical Committee 203 /
Comité technique 203
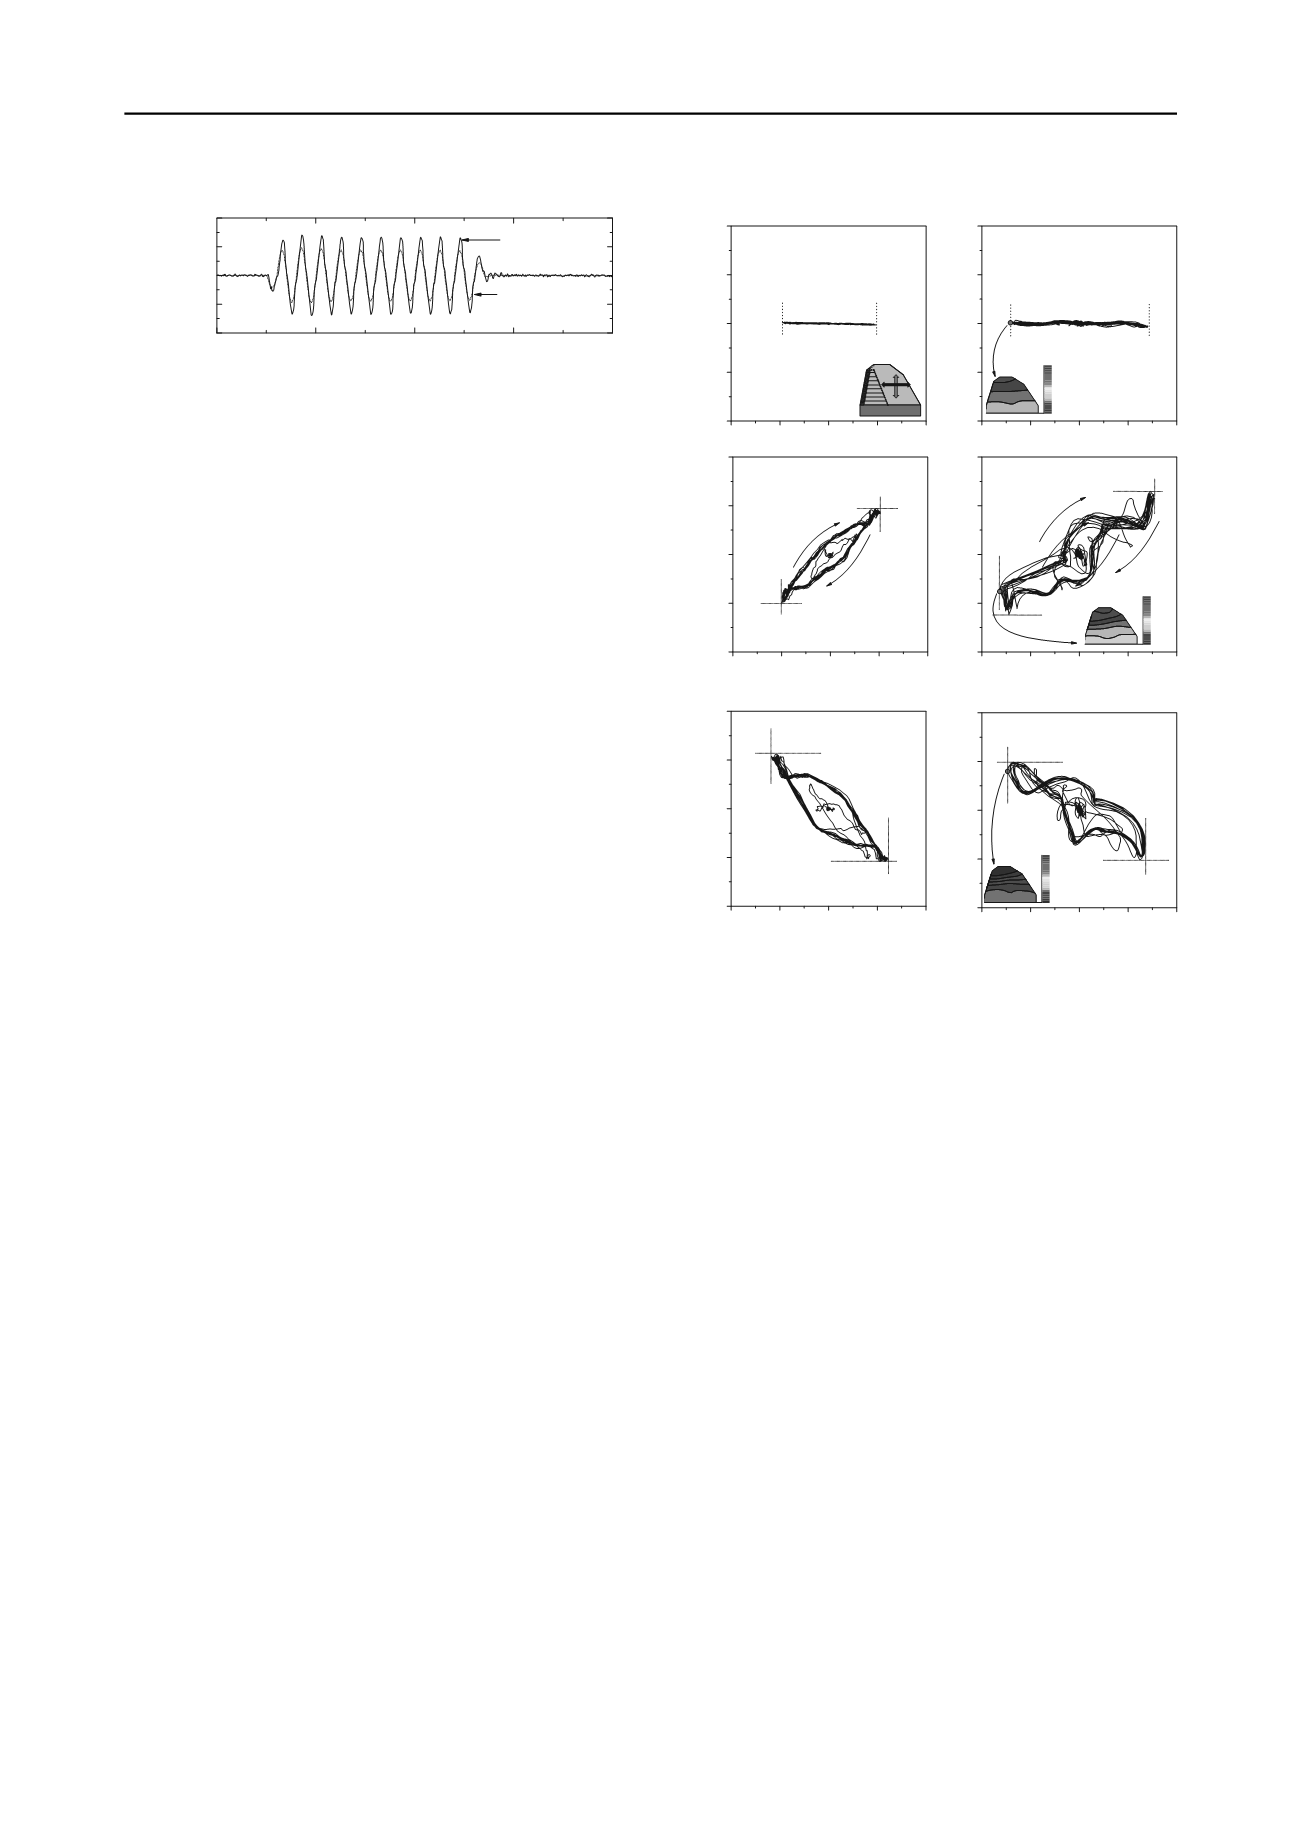
Figure 4. Representative time histories of horizontal acceleration
measured at the shaking table and the top of the slope under the
sinusoidal excitation.
6 TEST RESULTS
6.1 Shaking table test results under sinusoidal excitation
Figure 4 shows a representative time histories of horizontal
acceleration measured at the shaking table and the top of the
slope under the sinusoidal excitation having only the horizontal
component. There was clear amplification at the top of the slope
from 1.5 to 1.9 times as compared to that of the shaking table.
This trend can be seen in other similar cases.
Figure 5 shows orbits between the horizontal and vertical
accelerations measured at the shaking table and the top of the
slope. The directions of accelerometers were simultaneously
depicted in Figure 5a). Figure 5a) and b) show the test results
under only the horizontal seismic excitation, Figure 5c) and d)
show the test results under seismic excitation without phase
difference, and Figure 5e) and f) show the test results under
seismic excitation with a phase difference of 180 in degrees.
From Figures 5a) and b),the amplification of the horizontal
acceleration measured at the top of the slope became 1.5 times
as compared to that of the shaking table regardless of the
direction of the horizontal acceleration. This indicates that the
slope uniformly responded due to small plastic deformation
under the sinusoidal excitation with the maximum horizontal
acceleration of 200 gal. From Figure 5c) and d), the
amplification of the horizontal acceleration measured at the top
of the slope became 1.64 times as compared to that of the
shaking table regardless of the direction of the horizontal
acceleration.
Here, the following is a discussion about a contribution of the
vertical acceleration to the horizontal amplification focused on
the negative acceleration. In this case, the minimum horizontal
acceleration became -200 gal of the shaking table as shown in
Figure 5c) so that the horizontal amplification would be 1.5
times as compared to that of the shaking table which is equal to
-300 gal . In the meantime, the actual horizontal acceleration
measured at the top of the slope reached -327 gal. This means
that the difference of the 27 gal is the contribution of the
vertical acceleration to the horizontal amplification.
Consequently, it is revealed that a percentage of the above
contribution is 9% which can be obtained to be normalized by
the amplified minimum horizontal acceleration (-300 gal)
without the effect of vertical acceleration as mentioned before.
Moreover, Figures 5c) and 5d) show that the vertical
amplification increased when the vertical acceleration exhibited
to the upward (positive) direction. The range of the vertical
amplification exhibited from 1.24 to 1.27 times.
From Figures 5e) and 5f), the amplifications of the horizontal
and vertical accelerations depended on those direction. More
specifically, the amplifications of the horizontal acceleration
became 1.67 times in the positive direction and 1.88 times in the
negative direction. In addition, the amplifications of the vertical
acceleration became 1.23 times in the positive direction and
1.14 times in the negative direction.
Similar to the above, the following is a discussion about a
contribution of the vertical acceleration to the horizontal
amplification focused on the negative acceleration. In this case,
13
14
15
16
17
-400
-200
0
200
400
Top of the slope
Horizontal
Acceleration (gal)
Time (s)
Shaking table
-400
-200
0
200
400
Figure 5. Orbits between the horizontal and vertical accelerations
measured at the shaking table and the top of the slope: a) shaking table
under only the horizontal seismic excitation, b) top of the slope under
only the horizontal seismic excitation, c) shaking table under seismic
excitation without phase difference, d) top of the slope under seismic
excitation without phase difference, e) shaking table under seismic
excitation with phase difference of 180 in degrees, f) top of the slope
under seismic excitation with phase difference of 180 in degree.
the minimum horizontal acceleration is -235 gal as shown in
Figure 5e) so that the expected horizontal acceleration without
effect of vertical acceleration would be -353 gal. In the
meantime, the actual minimum horizontal acceleration became -
441 gal, which indicates that the contribution of the vertical
acceleration is 88 gal. Consequently, it is revealed that a
percentage of the above contribution is 25% which can be
obtained to be normalized by the amplified minimum horizontal
acceleration (-353 gal) without the effect of vertical acceleration.
As a result, the amplification of the acceleration increased
under both the horizontal and vertical sinusoidal excitation
when the inertia force applies in the parallel direction to the slop
inclination.
6.2. Shaking table test results under recorded seismic
excitation
Figure 6 shows the orbit between the horizontal and vertical
accelerations measured at the top of the slope. A contour map at
the time of minimum acceleration recorded is simultaneously
depicted in Figure 6. As compared to the orbit as show in Figure
2b), the horizontal amplifications in the positive and negative
directions are 1.30 and 1.28 times, respectively. In addition, the
vertical amplifications in the positive and negative directions
are 1.39 and 1.49 times, respectively. Moreover, as shown in
Figure 6, the vertical acceleration on the shaking table exhibited
zero at the time exhibiting the minimum horizontal acceleration
-400 -200 0 200 400
a)
-190 gal
―
+
―
+
Vertical acceleration (gal)
Horizontal acceleration (gal)
-400 -200 0 200 400
-400
-200
0
200
400
b)
Vertical acceleration (gal)
Horizontal acceleration (gal)
-400
0
400
-282 gal
-280 gal
194 gal
-400 -200 0 200
-400
-200
0
200
400
400
c)
Horizontal acceleration (gal
-200 gal
-199 gal
Vertical acceleration (gal)
)
189 gal
204 gal
-400 -200 0 200 400
-400
-200
0
200
400
d)
-400
0
400
-247 gal
259 gal
310 gal
Vertical acceleration (gal)
-327 gal
Horizontal acceleration (gal)
-400 -200 0 200
-400
-200
0
200
400
400
e)
Horizontal acceleration (gal)
-217 gal
Vertical acceleration (gal)
225 gal
-235 gal
243 gal
-600 -300 0 300 600
-600
-300
0
300
600
f)
-400
0
400
-304 gal
295 gal
-441 gal
406 gal
Horizontal acceleration (gal)
Vertical acceleration (gal)


