 
          1601
        
        
          Technical Committee 203 /


            Comité technique 203
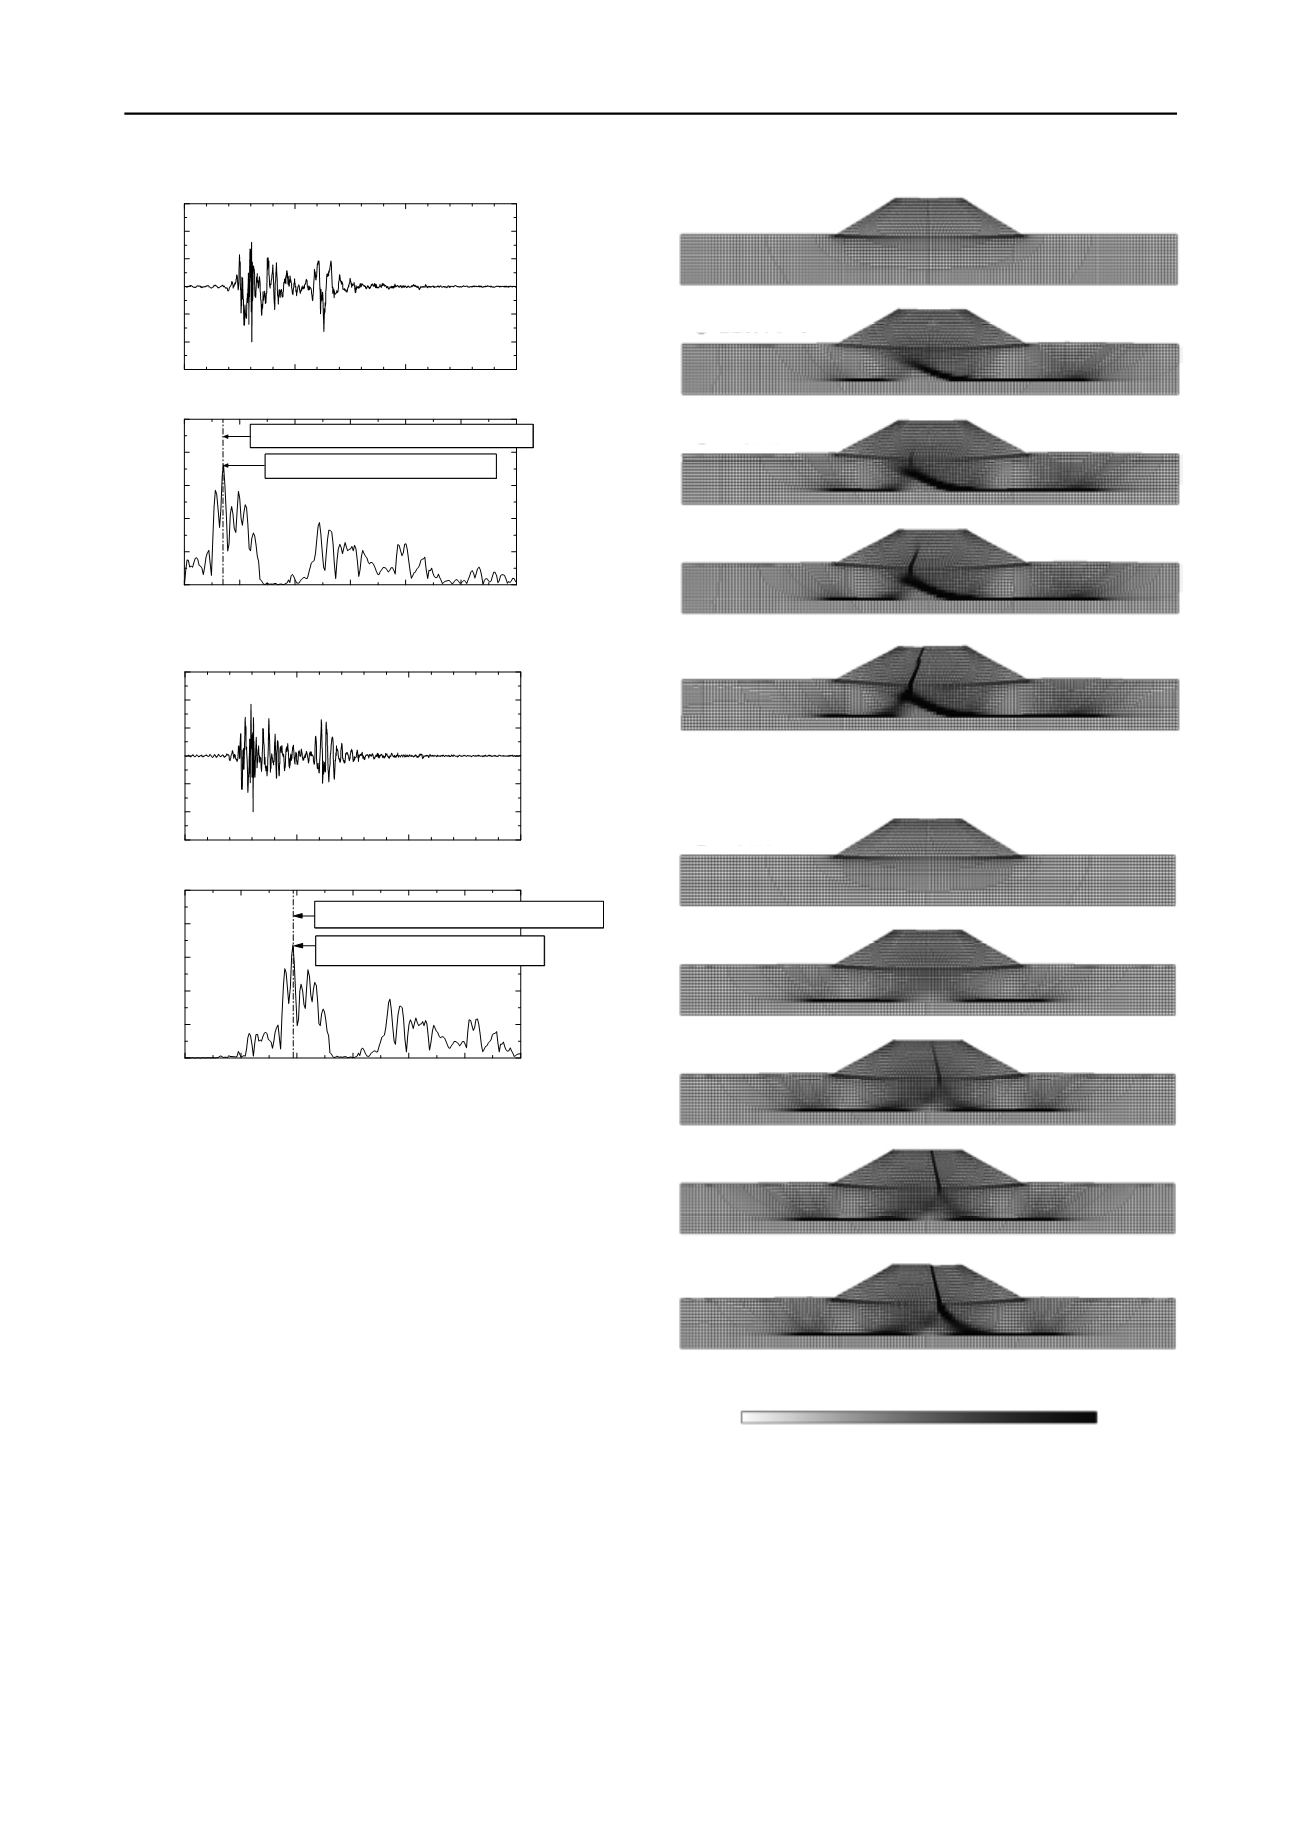


          (a) WAVE 1
        
        
          (b) WAVE 2
        
        
          Figure 3. Acceleration wave form and Fourier amplitude spectrum of
        
        
          input seismic waves
        
        
          However, with the progress of time, a slip surface developed in
        
        
          the embankment and subsequently expanded into the ground.
        
        
          That is, we observed a significant difference in the delayed
        
        
          failure behavior of the soil structure-ground system depending
        
        
          on the dominant frequency of the seismic wave.
        
        
          In order to elucidate the reason for this difference in the
        
        
          progression of delayed failure, we first investigated the
        
        
          differences in vibration characteristics during the earthquake in
        
        
          the two cases. The Fourier amplitude spectrum of the
        
        
          acceleration response for the layer boundary at the center of the
        
        
          ground is presented in Figure 5. We see that in CASE 1, the
        
        
          frequency component that was close to the dominant frequency
        
        
          of WAVE 1 underwent substantial amplification at the top of
        
        
          the clay layer as the seismic wave passed from the ground to the
        
        
          embankment, and that this area experienced resonance
        
        
          corresponding to MODE 1 (upper panel of Figure 2), which
        
        
          caused large-scale deformation of the clay layer. In CASE 2, the
        
        
          frequency component that was close to the dominant frequency
        
        
          of WAVE 2 underwent substantial amplification at the crown of
        
        
          the embankment and the embankment experienced resonance
        
        
          corresponding to MODE 2 (lower panel of Figure 2) that caused
        
        
          large-scale deformation of the embankment.
        
        
          (a) CASE 1 (Slip surface develops from ground to embankment)
        
        
          (b) CASE 2 (Slip surface develops from embankment to ground)
        
        
          Figure 4. Shear strain distributions
        
        
          Next, we investigated the mechanisms underlying the
        
        
          delayed failures observed in our simulations. The distribution of
        
        
          excess pore water pressure when the earthquake stopped is
        
        
          presented in Figure 6. It can be seen that, in both cases, the
        
        
          upper portion of the ground and inside the embankment
        
        
          experienced a negative excess pore water pressure, while the
        
        
          central to lower portions of the ground experienced positive
        
        
          excess pore water pressure. Because the upper portion of the
        
        
          ground and the embankment were in an overconsolidated state
        
        
          prior to the earthquake, when subjected to undrained shear
        
        
          0
        
        
          10
        
        
          20
        
        
          30
        
        
          -300
        
        
          -200
        
        
          -100
        
        
          0
        
        
          100
        
        
          200
        
        
          300
        
        
          Time


            t


          (sec)
        
        
          Acceleration


            a


          (cm/sec
        
        
          2
        
        
          )
        
        
          0
        
        
          1
        
        
          2
        
        
          3
        
        
          4
        
        
          5
        
        
          6
        
        
          0
        
        
          2
        
        
          4
        
        
          6
        
        
          8
        
        
          10
        
        
          Frequency


            f


          (Hz)
        
        
          Fourier amplitude
        
        
          spectrum (gal
        
        
          ・
        
        
          sec)
        
        
          Dominant frequency
        
        
          :
        
        
          0.708 Hz
        
        
          Natural frequency of MODE 1 : 0.699 Hz
        
        
          0
        
        
          10
        
        
          20
        
        
          30
        
        
          -300
        
        
          -200
        
        
          -100
        
        
          0
        
        
          100
        
        
          200
        
        
          300
        
        
          Time


            t


          (sec)
        
        
          Acceleration


            a


          (cm/sec
        
        
          2
        
        
          )
        
        
          0
        
        
          1
        
        
          2
        
        
          3
        
        
          4
        
        
          5
        
        
          6
        
        
          0
        
        
          2
        
        
          4
        
        
          6
        
        
          8
        
        
          10
        
        
          Frequency


            f


          (Hz)
        
        
          Fourier amplitude
        
        
          spectrum (gal
        
        
          ・
        
        
          sec)
        
        
          Dominant frequency
        
        
          :
        
        
          1.929 Hz
        
        
          Natural frequency of MODE 2 : 1.935 Hz
        
        
          1) Before earthquake
        
        
          2) End of earthquake
        
        
          3) 21h after earthquake
        
        
          4) 60h after earthquake
        
        
          5) 30yr after earthquake
        
        
          1) Before earthquake
        
        
          2) End of earthquake
        
        
          3) 69h after earthquake
        
        
          4) 70h after earthquake
        
        
          5) 30yr after earthquake
        
        
          0
        
        
          5
        
        
          10
        
        
          15
        
        
          20
        
        
          ε
        
        
          s
        
        
          (%)