1617
Technical Committee 203 /
Comité technique 203
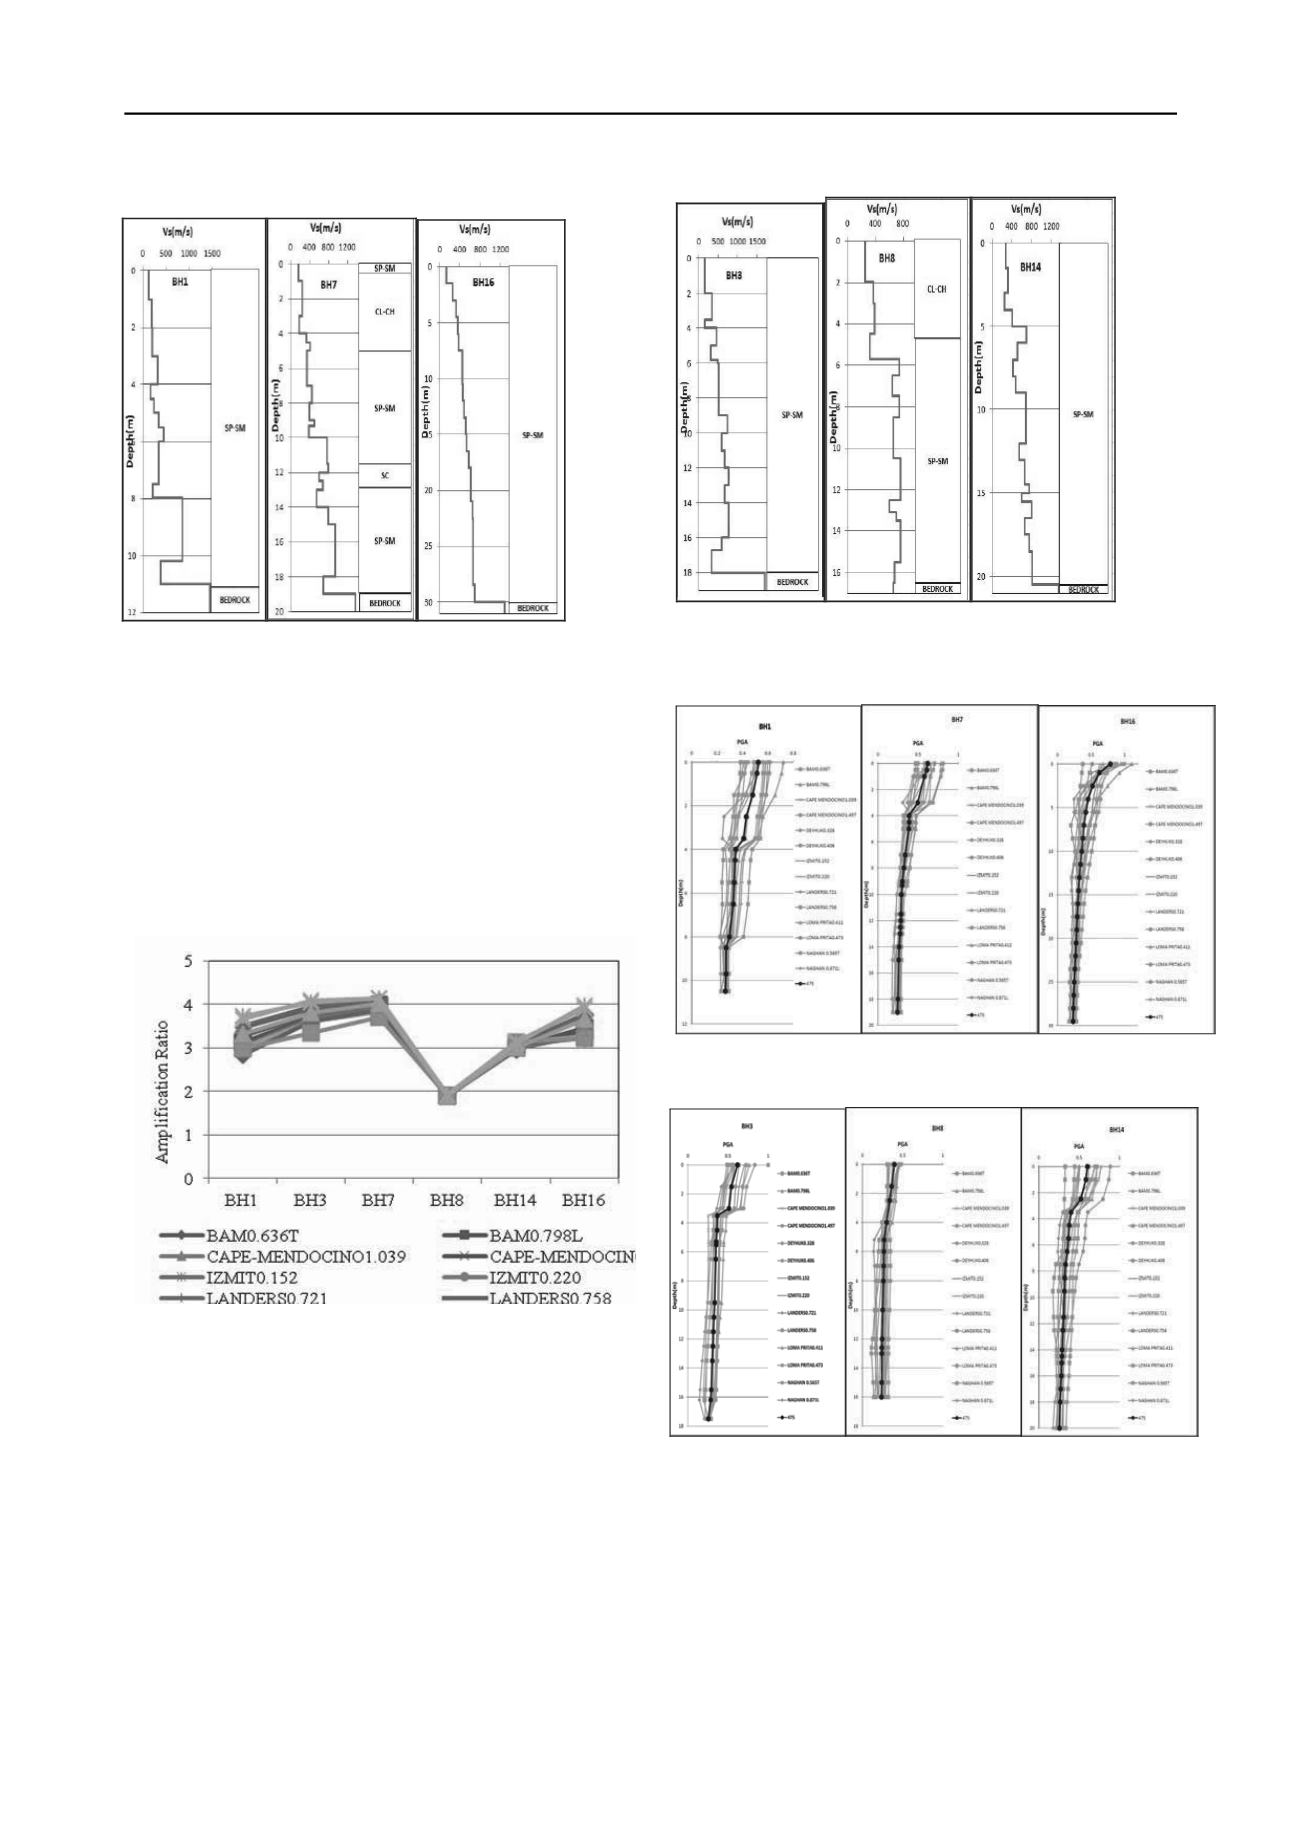
Figure 2. Soil profile and shear wave velocity along depth in boreholes
of group1.
5
ANALYSIS RESULTS
In order to evaluate the ground response and amplification ratio
of boreholes for study area based on one dimensionally shear
wave velocity theory, 14 series of analysis -seven couple of
time histories-have done.
As shown in figure 4 the general trend for them is similar
and dispersion of amplification ratios in different time histories
can be attributed to the effect of frequency content.
Figure 4. Amplification ratio of boreholes in different time histories.
According to correlation between PGA values and
amplification ratio, PGA curves versus depth can show the
effect of shear wave velocity variation on amplification ratio .
In figures 5&6 compared with Figures 2&3 the effect of sudden
changes in shear wave velocity of sub-layers on PGA ratio is
clear.
Sub-layers thickness plus to their shear wave velocity affect
on soil profile amplification ratio. It may be ignored in Equation
1 that used in Earthquake Codes for specify soil category and
amplification ratio.
Figure 3. Soil profile and shear wave velocity along depth in boreholes
of group2.
Figure 5. PGA curves for boreholes of group1.
Figure 6. PGA curves for boreholes of group2.
According to previous explanation and PGA curves
compared with shear wave velocity of soil sub-layers, effect of
sub-layers thickness from different categories of Euro Code
takes into consideration. Also divided sub-layers of each
borehole along its depth that marked with shear wave velocity is
shown in figure7.
More accurate comparison between these boreholes
indicates effect of very soft soil layers on amplification ratio.
All boreholes in group 1 area, have a very soft sub-layer in soil
profile -its shear wave velocity is between 0-180 m/s(D


