1620
Proceedings of the 18
th
International Conference on Soil Mechanics and Geotechnical Engineering, Paris 2013
performed to demonstrate the effect in a stress condition
corresponding to a proto-type scale. There were two series of
model tests, which were called Series A and B. In Series A,
rigid side-walls of a specimen box were used to reduce the
lateral displacement of the floating-type treated soil. Meanwhile,
a fixed-type structure was placed at the side of the floating-type
treated soil in Series B. Through these series, the effect of
countermeasure was examined.
2 VERIFICATION OF MECHANISM
One-dimensional dynamic response analyses besed on a finite
element method were used to assess the amplitude of shear
stress of the stratum between the floating-type treated soil and
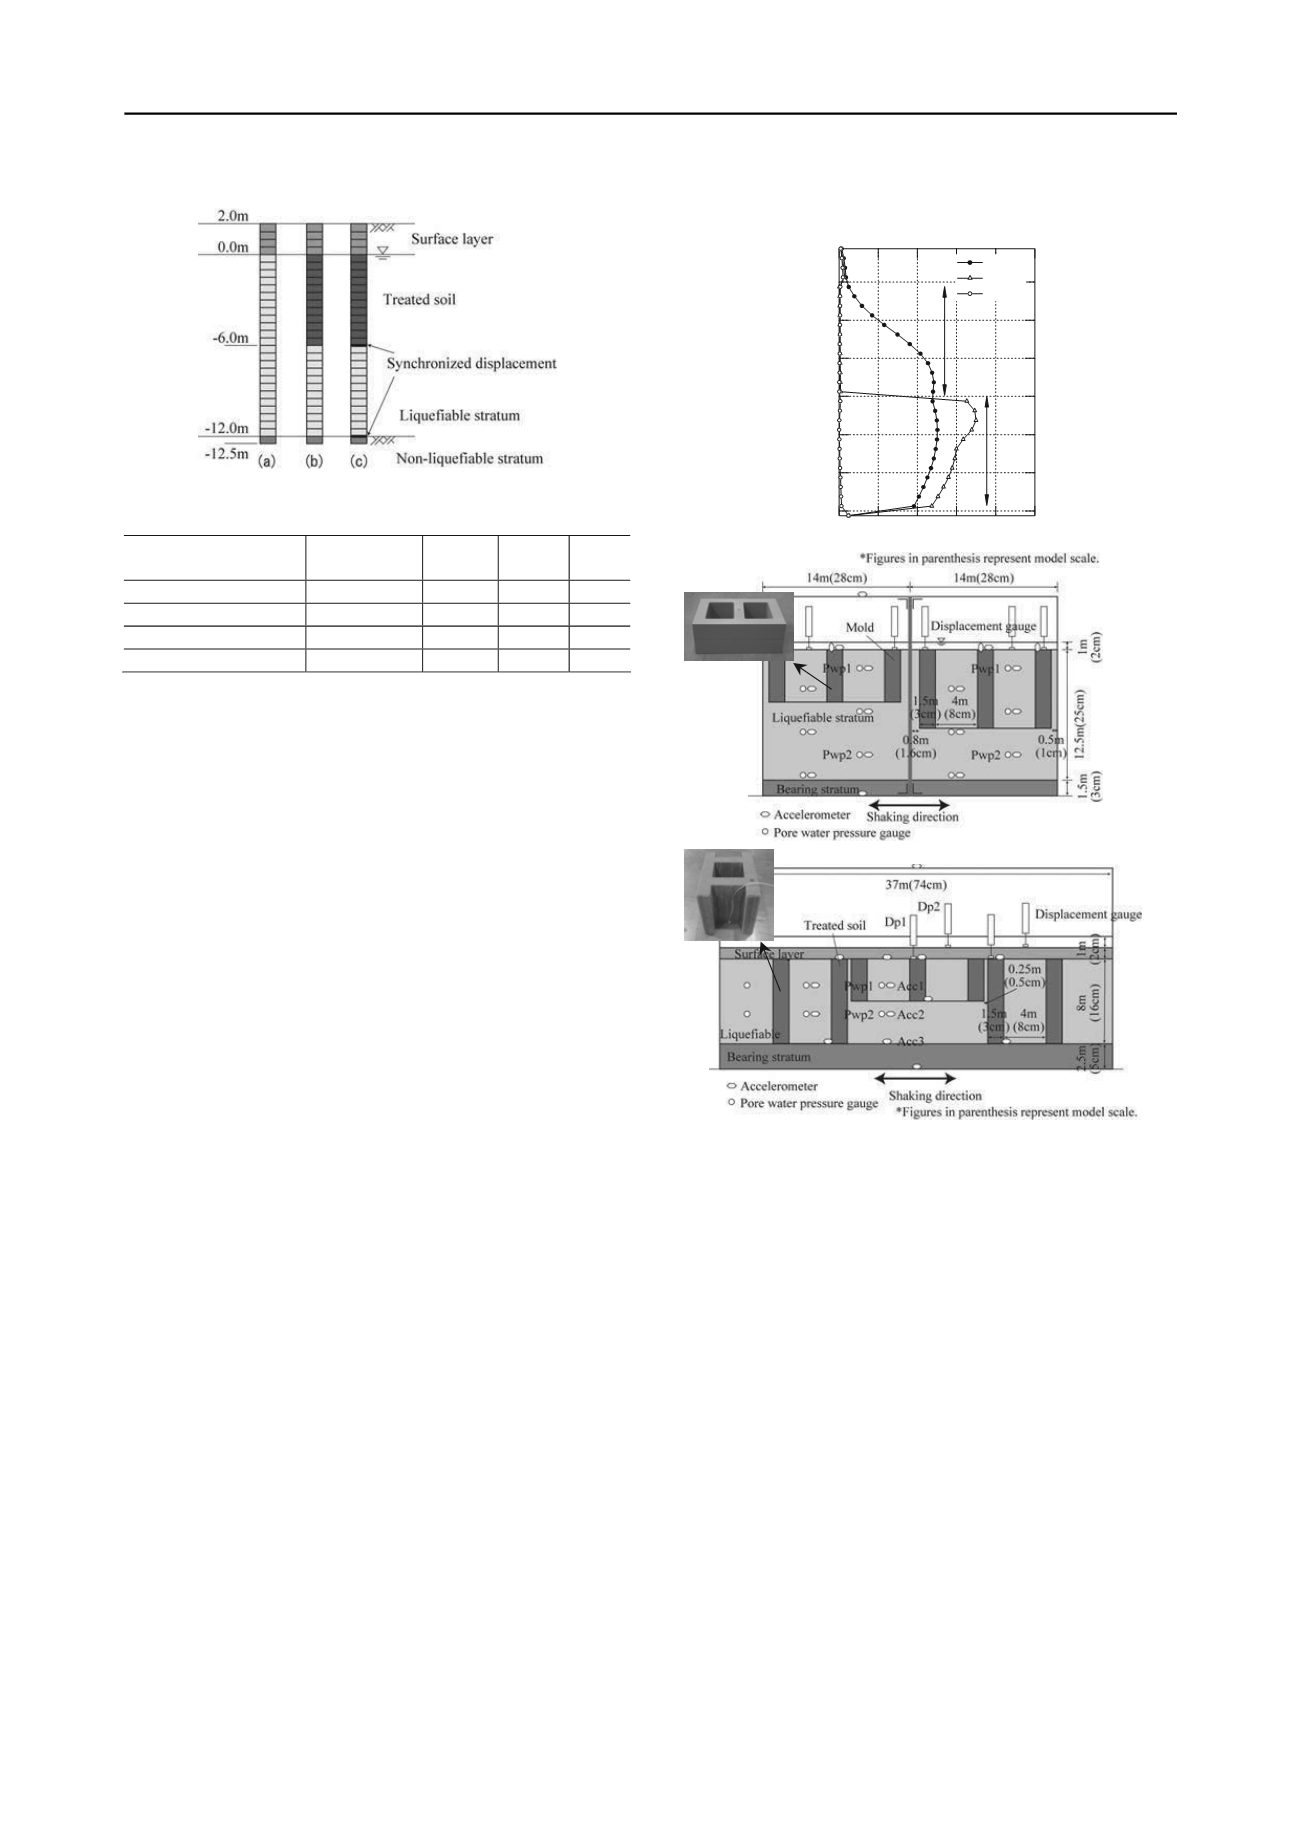
unliquefiable stratum. Figure 3 shows the analytical model, and
Table 1 is the list of soil parameters for the anayses. Case a was
for unimproved ground, and Cases b and c were for improved
ground. The lateral motions of the floating-type treated soil and
unliquefiable stratum were synchronized in Case c, not in Case
b. An elasto-plastic hyperbolic model was used for surface and
liquefiable layers as constitutive relations, and a linear elastic
model was for cement treated soil and unliquefiable layer.
Generation of excess pore water pressure was not modeled,
because the analyses were mainly conducted to verify low shear
stress of unimproved ground. The sinusoidal waves were input
for the numerical models, and its maximum amplitude and
shaking period were 3.0 m/s
2
and 20 seconds, respectively.
Figure 4 shows the depth distribution of maximum shear
strain calculated. As shown in Fig. 4, the shear strain at the
deeper stratum in Case b as well as Case a significantly
increased. With the large shear strain being generated, the
deeper stratum will be liquefied. In contrast, the shear strain at
the deeper stratum in Case c remained small due to the
synchronism of the motions of floating-type treated soil and
unliquefiable stratum. Thus, the synchronism of floating-type
treated soil and unliquefiable stratum takes effect, restricting
shear stress and liquefaction of in-between unimproved stratum.
3 CENTRIFUGE MODEL TESTS
3.1
Test model and procedures
Figure 5 shows cross-section views of models in Series A and B,
and Table 2 is the list of test cases. As for the width of floating-
type treated soil, it was shortened because of the limitation of
width of specimen box used. Series A used the specimen box
with the height of 20.0 m, the width of 28.0 m, and the depth of
9.0 m, although these values are converted to proto-type scales.
Meanwhile, Series B used the specimen box with the height of
25.0 m, the width of 37.0 m, and the depth of 10.0 m.
-12
-10
-8
-6
-4
-2
0
Depth (m)
5 4 3 2 1 0
Maximum shear strain (
xy
)
max
(%)
Improved
Unimproved
Case a
Case b
Case c
Figure 4. Shear strain distribution
Table 1. Soil parameters for numerical analyses
G
0
(MN/m
2
)
(
’
=98kN/m
2
)
(g/cm
3
)
(deg.)
h
max
Surface layer
62
1.84 39.0 0.24
Treated soil
150
2.04
-
-
Liquefiable layer
62
2.04
39.0
0.24
Non-liquefiable layer
37
2.04
-
-
Figure 3. 1D numerical model to verify the mechanism of floating-type
method
Figure 5. Cross-section view of model grounds: upper; Series A, lower;
Series B
Firstly, a uniform unliquefiable sandy layer was prepared by
the technique of sand raining. Secondly, accelerometers and
pore water pressure gauges were hanged at their spots, followed
by another sand raining for liquefiable sandy layer. The sand
material was the cat.5 of Sohma sand that was taken in Japan.
Thirdly, the sand raining was stopped at the depth of the bottom
surface of floating-type treated soil, and the flat surface of sand
layer was formed by a vacuum. Finally, the model of floating-
type treated soil was put on the surface and filled with
liquefiable sand. The average relative densities of liquefiable
stratum were
D
r
= 46 ~ 54 % in Series A and
D
r
= 48 ~ 57 % in
Series B, respectively. In Series B, a surface layer was made to
model subgrade bed, using special cat.4 of Sohma sand. This
layer did not liquefy due to the high permeability.
The model of lattice-shaped treated soil in Series A was a
polyvinyl chloride mold, the unit weight of which was 13.7
kN/m
3
. In Series B, the cement treated soil of cat. 5 of Sohma
sand was used as the mold. It was made by mixing with sand
and early-strength cement at the dry weight ratio of 20 %. The
unconfined compressive strength of cement treated soil was
3219 ~ 5300 kN/m
2
, and the wet unit weight was 18.0 ~ 19.8
kN/m
3
. The grid spacing of lattice-shaped treated soil was set as
4 m. This spacing was based on the test result our previous
work (Takahashi
et al.
, 2006a, 2006c).


