1633
Technical Committee 203 /
Comité technique 203
where, c
0
= -3.43, c
1
= -0.352, c
2
= -0.402, c
3
= 0.798, c
4
= 1.72,
and c
5
= -1.50. The prediction equation can also estimate
N
c
at a
selected depth (z) by introducing the parameter
s
s
V
z
T
4
(6)
where
V
s is average shear wave velocity within depth z. In
addition, the site effect is accounted for by
2.0
0.1
1
Sa
Sa S
(7)
S
1
is the spectral ratio between 1.0 sec spectrum acceleration
Sa(1.0) and 0.2 sec spectrum acceleration Sa(0.2). Kishida and
Tsai have shown that their prediction equation can estimate
similar
N
c values as those of Lui et al. for sand (b=0.35) at the
ground surface.
Figure 4 b for cyclic softening of clay
5 ANALYSIS PROCEDURE
The procedure to consider strength softening in pseudo-static
analysis has four general steps: (1) estimation of the shear strain
amplitude and the equivalent number of uniform strain cycles
from the peak acceleration at the ground surface and other
seismological and site parameters; (2) estimation of strength
softening
of the soil based on the effective shear strain
amplitude, and the equivalent number of uniform strain cycles;
(3) estimation of the cyclic soil strength after cyclic softening
by multiplying the strength for 1 cycle by
.; (4)
implementation of reduced strength (representing post-
earthquake condition) in pseudo-static analysis. Details on the
analysis steps were described in Tsai and Mejia (2011). For
preliminary studies, the strength for 1 cycle of most clays may
be conservatively assumed equal to their static strength.
6 COMPARISON TO CASE HISTORIES
In this section, the above analysis procedure to estimate strength
softening was implemented in pseudo static analysis and
compared with the predicted consequences of such softening
with observed ground failure during past earthquakes.
1.1
Berryman Reservoir, California, CA, USA
Berryman Reservoir, owned and operated by the East Bay
Municipal Utility District, USA, is located in the City of
Berkeley in Alameda County, California, and is within the State
Alquist-Priolo Earthquake Fault Zone of the Hayward fault.
Previous seismic hazard investigations concluded that active
traces of the Hayward fault bisect the reservoir. Previous and
recent field and laboratory investigations indicated that
generally stiff cohesive soils (medium to high PI) grading to
highly weathered bedrock are present at the site.
To evaluate the seismic performance of the embankment,
URS (2008) developed a design response spectrum and site-
specific earthquake ground motions for input to the dynamic
slope stability analyses. Following the Mejia et al. (2009)
procedure, two-dimensional dynamic response analyses were
performed using QUAD4M to estimate the cyclic stresses and
accelerations induced by the design earthquake within the
reservoir embankment. This comprehensive analysis indicated
that the undrained strengths of the saturated clayey soils could
be reduced by as much as 40 percent under the post-earthquake
condition. Given the same design scenario as listed in Table 2,
strength softening was also calculated using the simplified
procedure proposed in this paper. It was found that the strengths
of the saturated soils could be reduced by approximately 25-30
percent. Although the predicted strength reduction is less than
that by Mejia et al.’s procedure, it is still a reasonable, first-
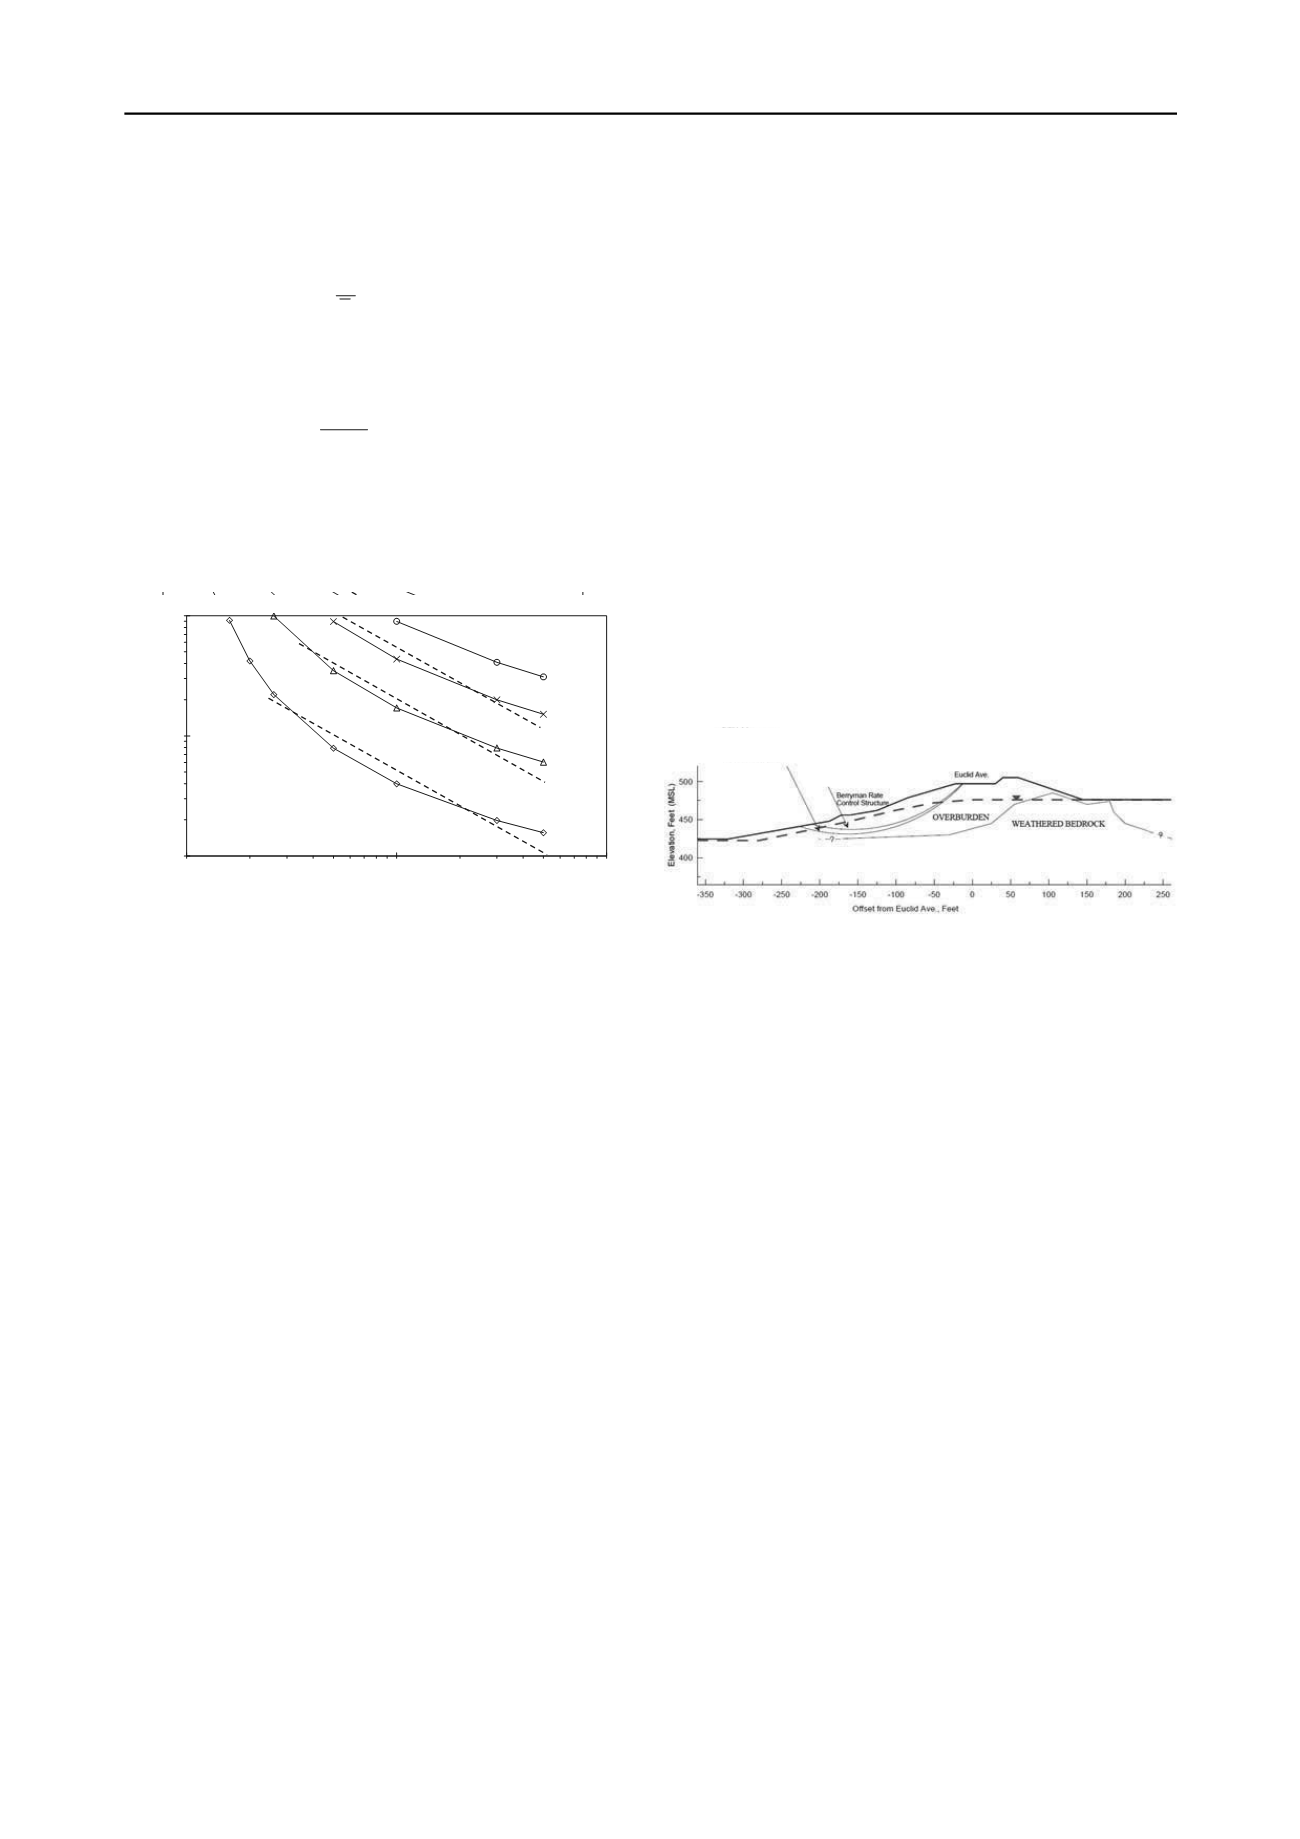
order estimate of cyclic softening of stiff clay. The yield
accelerations, obtained from pseudo static analyses using
UTEXAS4, were 0.16g for the pre-earthquake (no strength
reduction) and 0.12g and 0.1 for post-earthquake condition with
30% and 40% strength softening, respectively. The critical
failure plane is shown in Figure 5.
0.1
1
10
1
10
Figure 5 Pseudo-static analysis considering strength softening at
Berryman Reservoir
1.2
Carrefour Shopping Center 1999 Kocaeli
The Carrefour Shopping Center Lot C case history (Martin et al.
2004) provided a unique set of in situ ground deformation
measurements in ML/CL and CH strata from settlement
extensometers during the 1999 Kocaeli earthquake. This case
history provides an excellent example of how fine-grained soils
can develop significant strains or fail due to seismic loading,
and an opportunity to evaluate the procedures presented herein.
As shown in Figure 6a, the soil profile at Lot C includes a
surface layer of approximately 2 m of medium dense fill
(gravelly clay, GC). The next 5 m of soil consists of saturated,
soft to firm, low plasticity silt and clay (ML/CL) having average
PI and LL values of 10 and 33, respectively. This layer is
underlain by about 1.2 m of loose to medium-dense silty sand,
and sand (SP/SM) having a typical equivalent clean sand
corrected SPT blow count ((
N
1
)
60,cs
) value of about 12. The sand
layer is underlain by about 0.9 m of ML/CL soils, followed by
medium to stiff, high plasticity clay (CH) that extends to depths
greater than 35 m and has an average PI value of 37.
The vertical strains induced in the fine-grained soil layers by
the earthquake are largely attributed to undrained shear failure
beneath the surcharge, as illustrated in Figure 6a. The settlement
records in Figure 6b do show a modest increase in the rate of
settlement from just before the earthquake to just after the
earthquake. It is reasoned that the earthquake likely induced
moderate excess pore pressures and that the increase in
settlements was largely due to undrained shear failure induced
by bearing-capacity mode of deformation.
100
No. of cycles (N)
Cyclic strain
(%)
log
= a-b*log N
b=1
b=1
b=1
=0.9
=0.8
=0.7
=0.6
FS=1.7 (preearthquake)
FS=1.6, ky=016g (duringearthquake,nostrength reduction)
FS=1.4, ky=012g (duringearthquake,30%strength reduction)
FS=1.3, ky=010g (duringearthquake,40%strength reduction)
WCC (1987)
FS=2.14, ky=0.32g
where
V
s is average shear wave velocity within depth z. In
addition, the site effect is accounted for by
2.0
0.1
1
Sa
Sa S
(7)
S
1
is the spectral ratio between 1.0 sec spectrum acceleration
Sa(1.0) and 0.2 se spectrum acceleration Sa(0.2). Kishida and
Tsai have shown that their prediction equation can stimate
similar
N
c values as those of Lui et al. for sand (b=0.35) at the
ground surface.
Figure 4 b for cyclic softening of clay
5 ANALYSIS PROCEDURE
The procedure to consider strength softening in pseudo-static
analysis has four general steps: (1) estimation of the shear strain
amplitude and the equivalent number of uniform strain cycles
from the peak acceleration at the ground surface and other
seismological and site parameters; (2) estimation of strength
softening
of the soil based on the effective shear strain
amplitude, and the equivalent number of uniform strain cycles;
(3) estimation of the cyclic soil strength after cyclic softening
by multiplying the trength for 1 cycle by
.; (4)
implementation of reduced strength (representing post-
earthquake cond tion) in pseudo- ta ic analysis. Details on the
analysis steps were described in Tsai and Mejia (2011). For
preliminary studies, the strength for 1 cycle of most clays may
be conservatively assumed equal to their static strength.
6 COMPARISON TO CASE HISTORIES
In this section, the above analysis procedure to estimate strength
softening was implemented in pseudo static analysis and
compared with the predicted consequences of such softening
with observed ground failure during past earthquakes.
1.1
Berryman Reservoir, California, CA, USA
Berry a Reservoir, owned and operated by the East Bay
Municipal Utility District, USA, is located in the City of
Berkeley in Alameda County, Californ a, and is within the State
Alquist-Priolo Earthquake Fault Zone of the Hayward fault.
Previous seismic hazard investigations con lud d t at active
traces of the Hayward fault bisect the reservoir. Previous and
recent field and laboratory investigations indicated that
procedure, two-dimensional dynamic response analyses were
performed using QUAD4M to estimate the cyclic stresses and
accelerations induced by the design earthquake within the
reservoir embankment. This comprehensive analysis indicated
that the undrained strengths of the saturated clayey soils could
be reduced by as much as 40 percent under the post-earthquake
condition. Given the same design scenario as listed in Table 2,
strength softening was also calculated using the simplified
procedure proposed in this paper. It was found that the strengths
of the saturated soils could be reduced by approximately 25-30
percent. Although the predicted strength reduction is less than
that by Mejia et al.’s procedure, it is still a reasonable, first-
order estimate of cyclic softening of stiff clay. The yield
accelerations, obtained from pseudo static analyses using
UTEXAS4, were 0.16g for the pre-earthquake (no strength
reduction) and 0.12g and 0.1 for post-earthquake condition with
30% and 40% strength softening, respectively. The critical
failure plane is shown in Figure 5.
0.1
1
10
1
10
Figure 5 Pseudo-static analysis considering strength softening at
Berryman Reservoir
1.2
Carrefour Shopping Center 1999 Kocaeli
The Carrefour Shopping Center Lot C case history (Martin et al.
2004) provided a unique set of in situ ground deformation
measurements in ML/CL and CH strata from settlement
extensometers during the 1999 Kocaeli earthquake. This case
history provides an excellent example of how fine-grained soils
can develop significant strains or fail due to seismic loading,
and an opportunity to evaluate the procedures presented herein.
As shown in Figure 6a, the soil profile at Lot C includes a
surface layer of approximately 2 m of medium dense fill
(gravelly clay, GC). The next 5 m of soil consists of saturated,
soft to firm, low plasticity silt and clay (ML/CL) having average
PI and LL values of 10 and 33, respectively. This layer is
underlain by about 1.2 m of loose to medium-dense silty sand,
and sand (SP/SM) having a typical equivalent clean sand
corrected SPT blow count ((
N
1
)
60,cs
) value of about 12. The sand
layer is underlain by about 0.9 m of ML/CL soils, followed by
medium to stiff, high plasticity clay (CH) that extends to depths
greater than 35 m and has an average PI value of 37.
The vertical strains induced in the fine-grained soil layers by
the earthquake are largely attributed to undrained shear failure
beneath the surcharge, as illustrated in Figure 6a. The settlement
records in Figure 6b do show a modest increase in the rate of
settlement from just before the earthquake to just after the
earthquake. It is reasoned that the earthquake likely induced
moderate excess pore pressures and that the increase in
settlements was largely due to undrained shear failure induced
by bearing-capacity mode of deformation.
100
No. of cycles (N)
Cyclic strain
(%)
log
= a-b*log N
b=1
b=1
b=1
=0.9
=0.8
=0.7
=0.6
FS=1.7 (preearthquake)
FS=1.6, ky=016g (duringearthquake,nostrength reduction)
FS=1.4, ky=012g (duringearthquake,30%strength reduction)
FS=1.3, ky=010g (duringearthquake,40%strength reduction)
WCC (1987)
FS=2.14, ky=0.32g
wh re, c
0
= -3.43, c
1
= -0.352, c
2
= -0.402, c
3
= 0.798, c
4
= 1.72,
and c
5
= -1.50. The prediction equation can also estimate
N
c
at a
selected depth (z) by introducing the parameter
s
s
V
z
T
4
(6)
where
V
s is average shear wave velocity within depth z. In
addition, the site effect is accounted for by
2.0
0.1
1
Sa
Sa S
(7)
S
1
is the spectral ratio betw en 1.0 sec spectrum acceleration
Sa(1.0) and 0.2 sec spectrum acceleration Sa(0.2). Kishida and
Tsai have shown that their prediction equation can estimate
similar
N
c values as those of Lui et al. for sand (b=0.35) at the
ground surfac .
Figure 4 b for cyclic softening of clay
5 ANALYSIS PROCEDURE
The proce ure to consider strength softening in pseudo-static
analysis h s four g neral steps: (1) estimation of the shear strain
amplitude and the quivalent number of unif rm strain cycles
from the peak acceleration at the ground surfac and other
se smological and site parameters; (2) esti ation of strength
sof ening
of the soil based on the effective hear strain
ampli ude, and
equivalent number of uniform strain cycles;
(3) estimation f th cyclic soil strength after cyclic softening
by multiplying the strength for 1 cycl by
.; (4)
implem ntation of educed strength (representing post-
earthquake condition) in pseudo-static analysis. Details on the
analysi steps were described in Tsai and Mejia (2011). For
preliminary studies, the strength for 1 cycle of most clays may
be conservatively assumed equal to their static strength.
6 COMPARISON TO CASE HISTORIES
In this section, the above analysis procedure to estimate strength
softening was implemented in pseudo st tic analysis and
compared with the predicted consequences of such softening
with observed ground failure during past earthquakes.
1.1
Berryman Reservoir, California, CA, USA
B rryman Res rvoir, owned and operated by the East Bay
Municipa Utili y District, USA, is located in the City of
Berkeley in Alameda County, California, and is within the State
Alquis -Priolo E thquake Fault Zon of the Hayward fault.
Previous seismic hazard investiga ons conclu ed that ac ive
traces of the Hayward fault bisect the reservoir. Previous and
recent field and laboratory investigations indicated that
general y stiff coh sive soils (medium to high PI) gradi g to
highly weather d bedrock are present at the site.
To evaluate the seismic performance of the embankment,
URS (2008) developed a design response sp ctrum and site-
specific earthquake groun motions for input to the dynamic
slope stability analyses. Following Mejia et al. (2009)
procedure, two-dimensional ynamic response analyses were
performed using QUAD4M to estimate the cycl c stresses and
accelerations induced by the design earthquake within the
servoir embankment. This comprehensiv analysis indicated
that the undrained strengths of th satur ted clayey soils could
be reduced by as much as 40 percent under the po t-earthquake
ondition. Given the same design scenario as listed in Table 2,
streng h soften ng was also calculated using th simplified
procedure proposed in th s paper. It was fo nd that the trengths
of the saturated soils c ul b reduced by appr ximately 25-30
percent. Alth ugh the predicted strength reduction is less than
that by Mejia et al.’s procedure, it is s ll a reasonable, first-
order estimate of cyclic softening of stiff clay. The yield
a celerations, obt ined fr m ps udo static a alyses using
UTEXAS4, we 0.16g for the pre- arthquake (no s rength
reduction) nd 0.12g and 0.1 for post-earthquake condition with
30% and 40% stren th softening, resp ctively. The critical
failure plane is shown in Figure 5.
0.1
1
10
1
10
Figure 5 Pseudo-static analysis considering strength softening at
Berryman Reservoir
1.2
Carrefour Shopping Center 1999 Kocaeli
The Carrefour Shopping Ce ter Lot C c se history (Martin e al.
2004) provided a unique set f in situ ground deformation
measurements in ML/CL and CH strata from settlement
ext ns meters duri g he 1999 Kocaeli earthquake. This case
hist ry p ovides an excellent xample of how fi e-grain d soils
can develop significant strains or fai due to seismic loading,
and an opportunity t evaluate the procedur s presented herein.
As shown in Figure 6a, the soil profile at L t C includes a
surface layer of approximately 2 m of medium dense fill
(gravelly clay, GC). The next 5 m of soil consists of saturated,
soft to firm, low plasticity silt and clay (ML/CL) having average
PI nd LL values of 10 and 33, respectiv ly. This layer is
und rlain by about 1.2 m of loose to medium-dense silty sand,
and sand (SP/SM) having a typical equivalent clean sand
corrected SPT blow count ((
N
1
)
60,cs
) value of about 12. The sand
layer is underlain by about 0.9 m of ML/CL soils, followed by
medium to stiff, high plastic ty clay (CH) that extends to depths
grea er than 35 m and has an av rage PI value of 37.
The verti al strain induced in the fine-grained oil lay rs by
the earthquak are largely attribut d to undrained she r failure
b neath the surcharg , as illustrated in Figure 6a. The s ttlement
records in F gu 6b do s ow a modest increas in the rate of
s ttlement from just before the earthquake to just after the
earthquake. It is reasoned that the eart quake likely induced
moderate ex ess pore pr ssures and that the increase in
settlements was largely due to undrained shear failure induced
by bearing-capacity mode of deformation.
100
No. of cycles (N)
Cyclic strain
(%)
log
= a-b*log N
b=1
b=1
b=1
=0.9
=0.8
=0.7
=0.6
FS=1.7 (preearthquake)
FS=1.6, ky=016g (duringearthquake,nostrength reduction)
FS=1.4, ky=012g (duringearthquake,30%strength reduction)
FS=1.3, ky=010g (duringearthquake,40%streng h reduction)
WCC (1987)
FS=2.14, ky=0.32g
selected depth (z) by introducing the parameter
s
s
V
z
T
4
(6)
where
V
s is average shear wave velocity within depth z. In
addition, the site effect is accounted for by
2.0
0.1
1
Sa
Sa S
(7)
S
1
is the spectral ratio between 1.0 sec spectrum acceleration
Sa(1.0) and 0.2 sec spectrum acceleration Sa(0.2). Kishida and
Tsai have shown that their prediction equation can estimate
similar
N
c values as those of Lui et al. for sand (b=0.35) at the
ground surface.
Figure 4 b fo cyclic softening of clay
5 ANALYSIS PROCEDURE
The procedure to consider strength softening in pseudo-static
analysis has four general steps: (1) estimation of the shear strain
amplitude and the equivalent number of uniform strain cycles
from the peak acceleration at the ground surface and other
seismological and site parameters; (2) estimation of strength
softening
of the soil based on the effective shear strain
amplitude, and the equivalent number of uniform strain cycles;
(3) estimation of the cyclic soil strength after cyclic softening
by multiplying the strength for 1 cycle by
.; (4)
implementation of reduced strength (representing post-
earthquak condition) in pseudo-static analysis. Details on the
analysis steps were described in Tsai and Mejia (2011). For
preliminary studies, the strength for 1 cycle of most clays may
be conservatively assum d equal o their static strength.
6 COMPARISON TO CASE HISTORIES
In thi section, the above analysi p ocedur o estimate str gth
softening was impl mented in pseudo static analysis and
compar d with the predict d cons qu c s of su h softening
with observed ground failure during past e rthquakes.
1.1
Ber yman Reservoir, California, CA, USA
Berryman Reservoir, owned and operated by the East Bay
Municipal Utility District, USA, is located in the City of
Berkeley in Alameda County, California, and is within the State
Alquist-Priolo Earthquake Fault Zone of the Hayward fault.
Previous seismic hazard investigations concluded that active
traces of the Hayward fault bisect the reservoir. Previous and
recent field and laboratory investigations indicated that
To evaluate the seismic performance of the embankment,
URS (2008) developed a design response spectrum and site-
specific earthquake ground motions for input to the dynamic
sl pe stability analyses. Following the Mejia et al. (2009)
procedure, two-dimensional dynamic response analyses were
performed using QUAD4M to estimate the cyclic stresses and
accelerations induced by the design earthquake within the
reservoir embankment. This comprehensive analysis indicated
that the undrained strengths of th saturated clayey soils could
be reduced by as much as 40 erc under th post-earthquake
condition. Given the same design sc nario as listed in Table 2,
strengt softening was also calculated using the simplified
pro edur propos d in this paper. It was found that t stre gths
of th aturated soils could be reduced by approximately 25-30
perc nt. Although the predicted strength reduction is l ss than
that by Mejia et al.’s procedur , t is still a reasonable, first-
orde estimate of cyclic softening of stiff clay. The yield
accelerations, ob ained from ps udo ta ic na yses u ing
UTEXAS4, were 0.16g for the pre-ear hquake (no strength
reduction) and 0.12g and 0.1 for p st-earthquake condition w th
30% and 40% str ngth softeni g, respectively. The critical
failure plane is shown in Figure 5.
0.1
1
10
1
10
Figure 5 Pseudo-static analysis considering strength softening at
Berryman Reservoir
1.2
Carrefour Shopping Center 1999 Kocaeli
The Carrefour Shopping Center Lot C case history (Martin et al.
2004) provided a unique set of in situ ground deformation
measurements in ML/CL and CH strata from settlement
extensometers during the 1999 Kocaeli earthquake. This case
history provides an excellent example of how fine-grained soils
can dev lop significant strains or fail due to seismic loading,
and an opportunity to evaluate the procedures presented herein.
As shown in Figure 6a, the soil profile at Lot C includes a
surface layer of approximately 2 m of medium dense fill
(gravelly clay, GC). The next 5 m of soil consists of saturated,
soft to fi m, low plasticity silt and clay (ML/CL) having average
PI and LL values of 10 and 33, re pectively. This layer is
underlain by about 1.2 m of loose to medium-dense il y sa d,
and sand (SP/SM) having a typi l equivalent clean sand
corrected SPT blow count ((
N
1
)
60,cs
) value of about 12. The sand
lay r is underlain by about 0.9 m of ML/CL soils, followe by
medium to stiff, high plasticity clay (CH) that extends to depths
greater than 35 m and has an average PI value of 37.
The vertical stra ns induced in he fine-grained soil layers by
the earthquake are lar ely attributed to undrained shear fail r
beneath the surcharge, as illustr d in Figure 6a. The settl ment
records in Figure 6b do show a modest increase in the rate of
settleme t from just before the earthquake to just after the
earthquake. It is rea oned th t the earth ake likely duce
mod rate excess pore pressures and that the i crease in
settlements was largely d e to undrained shear f ilure induced
by bearing-capacity mode of deformation.
100
No. of cycles (N)
Cyclic strain
(%)
log
= a-b*log N
b=1
b=1
b=1
=0.9
=0.8
=0.7
=0.6
FS=1.7 (preearthquake)
FS=1.6, ky=016g (duringearthquake,nostrength reduction)
FS=1.4, ky=012g (duringearthquake,30%strength reduction)
FS=1.3, ky=010g (duringearthquake,40%strength reduction)
WCC (1987)
FS=2.14, ky=0.32g
where, c
0
= -3.43, c
1
= -0.352, c
2
= -0.402, c
3
= 0.798, c
4
= 1.72,
and c
5
= -1.50. The prediction equation can also estimate
N
c
at a
selected depth (z) by introducing the parameter
s
s
V
z
T
4
(6)
where
V
s is average shear wave velocity within depth z. In
addition, the site effect is accounted for by
2.0
0.1
1
Sa
Sa S
(7)
S
1
is the spectral ratio between 1.0 sec spectrum acceleration
Sa(1.0) and 0.2 sec spectrum acceleration Sa(0.2). Kishida and
Tsai have shown that their prediction equation can estimate
similar
N
c values as those of Lui et al. for sand (b=0.35) at the
ground surface.
Figure 4 b for cyclic softening of clay
5 ANALYSIS PROCEDURE
The procedure to consider strength softening in pseudo-static
analysis has four general steps: (1) estimation of the shear strain
amplitude and the equivalent number of uniform strain cycles
from the peak acceleration at the ground surface and other
seis ological and site parameters; (2) estimation of strength
softening
of the soil based on the effective shear strain
amplitude, and t equivalent number of uniform strain cycles;
(3) estimation of the cyclic soil strength after cyclic softening
by multiplying the strength for 1 cycle by
.; (4)
implementation of red c d strength (representing post-
earthquake condition) in pseudo-static analysis. Details on the
analysis steps wer described in Ts i and Mejia (2011). For
preliminary studies, the strength for 1 cycle of most clays may
be conservatively assumed equal to their static strength.
6 COMPARISON TO CASE HISTORIES
In this section, the above analysis procedure to estima e strength
softening was implemented n pseudo static analysis an
compared with the predicted consequences of such softening
with observed ground failure during past earthquakes.
1.1
Berryman Reservoir, California, CA, USA
Berryman Reservoir, owned and operated by the East Bay
Municipal Utility District, USA, is located in the City of
Berkeley in Alameda County, California, and is within the State
Alquist-Priolo Earthquake Fault Zone of the Hayward fault.
Previous seismic hazard investigations concluded that active
traces of the Hayward fault bisect the reservoir. Previous and
recent field and laboratory investigations indicated that
generally stiff cohesive soils (medium to high PI) grading to
highly weathered bedrock are present at e site.
To evaluate the seismi pe formance of the embankment,
URS (2008) developed a design resp nse spectrum and site-
spe ific earthquake ground otions f r input to the dynamic
slope stability analyses. Following the Meji et al. (2009)
procedure, two-dimensional dynamic response analyses were
performe using QUAD4M to estimat th cyc ic stresses and
accelerations induced by the design earthquake within the
reservoir embankment. This comprehensive analysis indicated
that the undrained strengths of the saturated clayey soils could
be reduced by as much as 40 percent under the post-earthquake
condition. Given the same design scenario as listed in Table 2,
strength softening was also calculated using the simplified
procedure proposed in this paper. It was found that the strengths
of the saturated soils could be reduced by approximately 25-30
percent. Although the predicted strength reduction is less than
that by Mejia et al.’s procedure, it is still a reasonable, first-
order estimate of cyclic softening of stiff clay. The yield
accelerations, obtained from pseudo static analyses using
UTEXAS4, were 0.16g for the pre-earthquake (no strength
reduction) and 0.12g and 0.1 for post-earthquake condition with
30% and 40% strength softening, respectively. The critical
failure plane is shown in F gur 5.
0.1
1
10
1
10
Figure 5 Pseudo-static analysis considering strength softe ing at
Berryman Reservoir
1.2
Carrefour Shopping Center 1999 Kocaeli
The Carrefour Shopping Center Lot C case history (Martin t al.
2004) provided a unique se of in situ ground deformation
measureme ts in ML/CL and CH strata from settlement
extensometers during the 1999 Kocaeli earthquake. This case
history provides n excel ent example of how fi e-grained soils
can develop significant strains or fail due to seismic loading,
and an opportunity to evaluate the procedures presented herein.
As shown in Figure 6a, the soil profile at Lot C includes a
surface layer of appr ximately 2 m of medium dense fill
(grav lly clay, GC). The next 5 m of soil consists of saturated,
soft to firm, low plasticity silt and clay (ML/CL) having averag
PI and LL values of 10 an 33, respectively. This layer is
underlain by about 1.2 m of loose to medium-dense silty sand,
and sand (SP/SM) having a typical equivalent clean sand
corrected SPT blow count ((
N
1
)
60,cs
) value of about 12. The sand
layer is underlain by about 0.9 m of ML/CL soils, followed by
medium to stiff, high plasticity clay (CH) that extends to depths
greater than 35 m and has an average PI value of 37.
The vertical strains induced in the fine-grained soil layers by
the earthquake are largely attributed to undrained shear failure
beneath the surcharge, as illustrated in Figure 6a. The settlement
records in Figure 6b do show a modest increase in the rate of
settlement from just before the earthquake to just after the
earthquake. It is reasoned that the earthquake likely induced
moderate excess pore pressures and that the increase in
settlements was largely due to undrained shear failure induced
by bearing-capacity mode of deformation.
100
No. of cycles (N)
Cyclic strain
(%)
log
= a-b*log N
b=1
b=1
b=1
=0.9
=0.8
=0.7
=0.6
FS=1.7 (preearthquake)
FS=1.6, ky=016g (duringearthquake,nostrength reduction)
FS=1.4, ky=012g (duringearthquake,30%strength reduction)
FS=1.3, ky=010g (duringearthquake,40%strength reduction)
WCC (1987)
FS=2.14, ky=0.32g


