 
          1192
        
        
          Proceedings of the 18
        
        
          th
        
        
          International Conference on Soil Mechanics and Geotechnical Engineering, Paris 2013
        
        
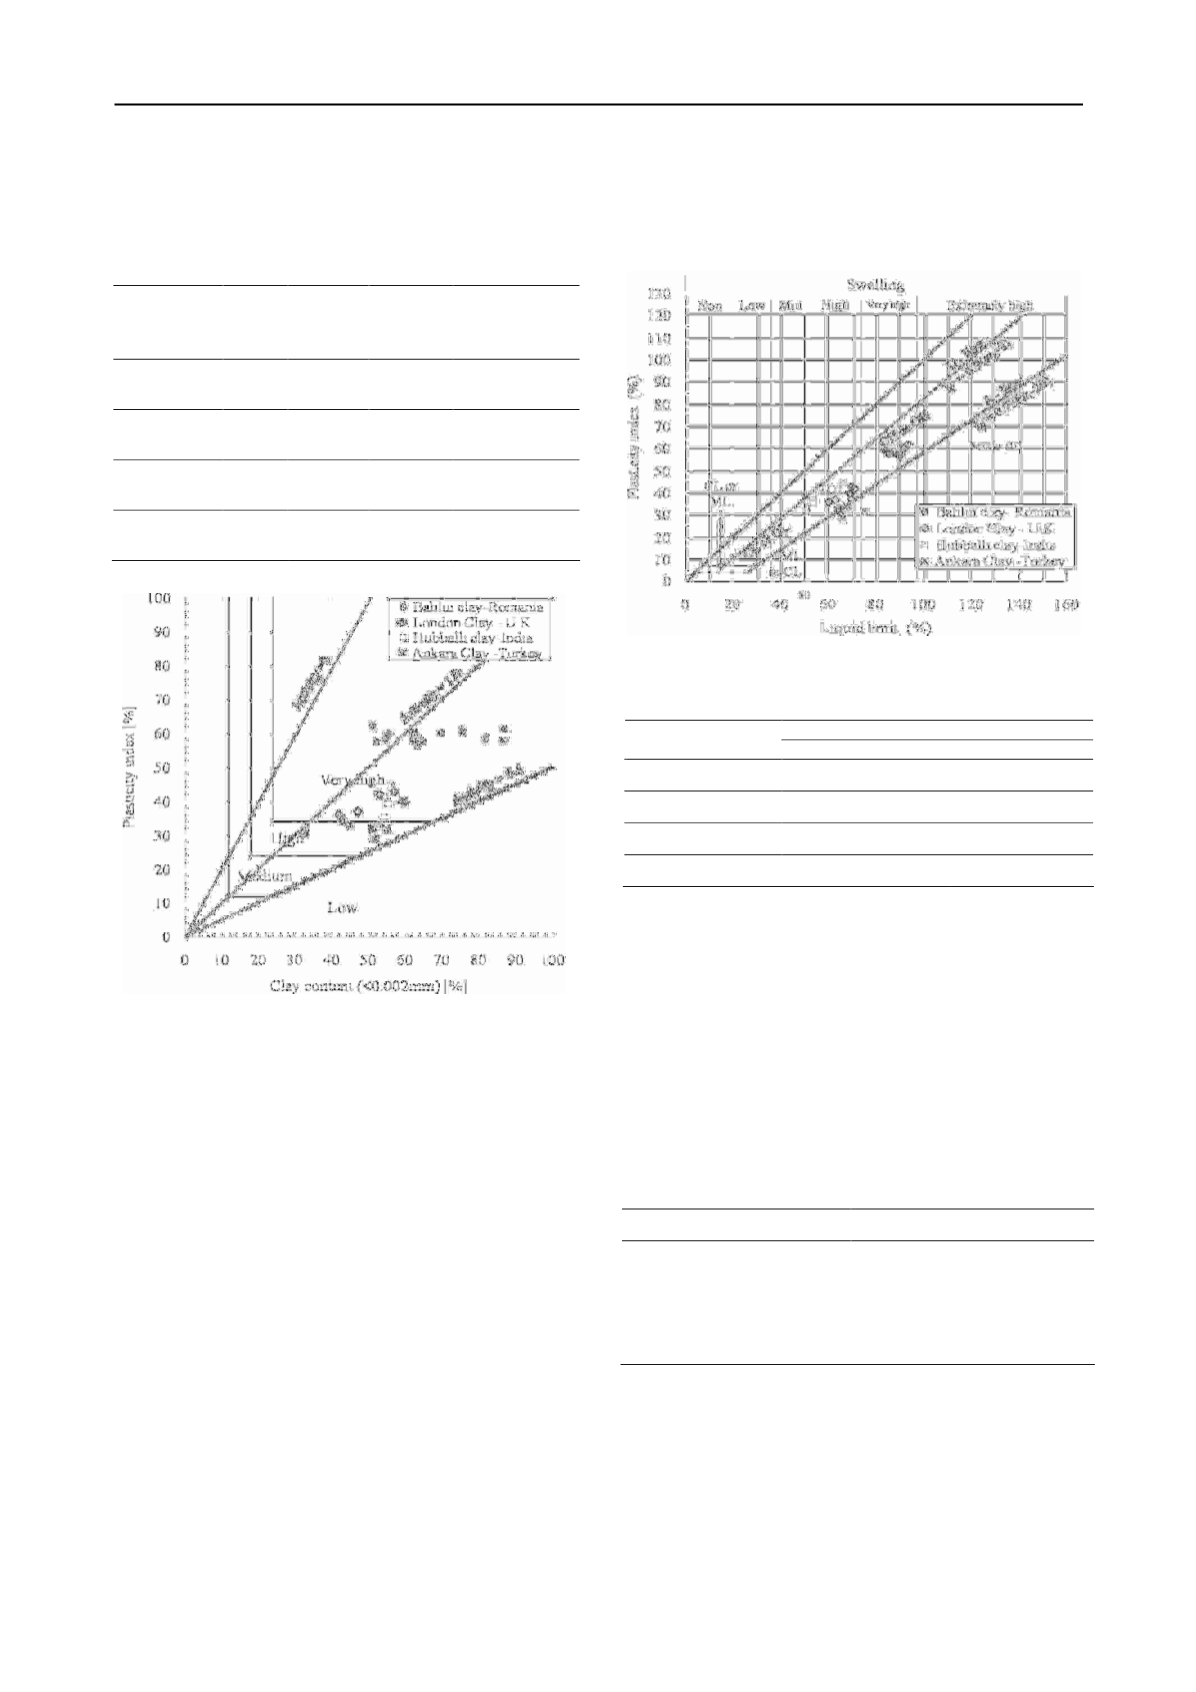
          reflects the attempt to correlate the degradation magnitude of
        
        
          constructions founded on such soils, with the intensity of the
        
        
          swell potential (Figure 1 and Figure 2) (Das 1995).
        
        
          Table 1. The physical properties of the representative investigated clays.
        
        
          Soil


            Liquid


            limit


            (%)


            Plasticity


            index (%)


            Colloidal


            fraction


            (%)


            Reference


          Bahlui clay-
        
        
          Romania
        
        
          83÷98 57÷67
        
        
          51÷87
        
        
          Boti, 1974
        
        
          London
        
        
          clay-U.K.
        
        
          60÷71 36÷43
        
        
          42÷60 Gasparre , 2005
        
        
          Hubballi
        
        
          clay- India
        
        
          51÷71 32÷53
        
        
          51÷56
        
        
          Hakari, 2010
        
        
          Ankara clay
        
        
          -Turkey
        
        
          64÷75 29÷34
        
        
          39÷55
        
        
          Hakari, 2010
        
        
          Figure 1. The classification of the swell potential, after Van Der Merwe,
        
        
          1964.
        
        
          It was noticed though, both from the published data and from
        
        
          the results in Table 2 that these two approaches (Van Der
        
        
          Merwe and Casagrande) using only two indices (I
        
        
          P
        
        
          , w
        
        
          L
        
        
          ),
        
        
          indicate different magnitudes of the swell potential for the same
        
        
          soil.
        
        
          By consequence, the Romanian Norms (STAS 1913/12-88
        
        
          and Code N.E. 0001-96) propose
        
        
          the use of the “soil chart” to
        
        
          identify and characterize the expansive soils. This
        
        
          representation, considered unique (Andrei 1980) and specific
        
        
          for each soil, is obtained by joining the points I; II; III; IV and
        
        
          V on a composite diagram by assembling on the same graph, the
        
        
          Casagrande-Chleborad diagram, the Skempton-Van Der Merwe
        
        
          diagram and the granulometric curve (Figure 3). The size of the
        
        
          figure area (I, II, III, IV and V), (


            A


          ) constitutes a first criterion
        
        
          to characterize the soil swell potential (Andrei 1997). The
        
        
          reference circle that intersects the 50% w
        
        
          L
        
        
          , I
        
        
          P
        
        
          , X
        
        
          d
        
        
          points and the
        
        
          1mm diameter as the point of interest on the diameter axis is
        
        
          introduced to scale the graph on the four axes. The normalized
        
        
          surface is calculated (
        
        
          0


            n


            A


          ) using the reference circle area (


            A


            circle


          )
        
        
          with the formula:
        
        
          0
        
        
          /


            n


            circle


            A A A


          (1)
        
        
          It is defined an activity coefficient (


            C


            A


          ), constructed
        
        
          similarly as the consistency index (I
        
        
          C
        
        
          ), to evaluate the
        
        
          magnitude of the swell potential (Stanciu et al. 2011), fixing as
        
        
          the variation limits, the chart minimum and maximum areas for
        
        
          two soils with extreme behaviour: with maximum content of
        
        
          kaolinit, as with the lowest potential, and of sodium
        
        
          montmorillonite as for soils with maximum volume variations.
        
        
          Figure 2. The classification of the swell potential based on the
        
        
          Casagrande’s plasticity chart
        
        
          .
        
        
          Table 2. The swell potential of the investigated clays.
        
        
          The classification of the swell potential after
        
        
          Soil
        
        
          Van Der Merwe
        
        
          Casagrande
        
        
          Bahlui clay-Romania
        
        
          Very high
        
        
          Very high
        
        
          London clay-U.K.
        
        
          Very high
        
        
          High
        
        
          Hubballi clay- India
        
        
          Very high
        
        
          High
        
        
          Ankara clay -Turkey
        
        
          High
        
        
          High
        
        
          By consequence, the activity coefficient


            C


            A


          for the
        
        
          normalized area of the soil chart


            n


            O


            A


          is given by the relation:
        
        
          (
        
        
          ) / (
        
        
          )


            n


            n


            n


            n


            A


            O C


            M C


            C A A A A


          (2)
        
        
          where:


            C


            A


          –
        
        
          the activity coefficient;


            n


            O


            A


          - the normalized area of
        
        
          the chart referring to the investigated soil;


            n


            C


            A


          - the normalized
        
        
          area of the kaolin chart;


            n


            M


            A


          - the normalized area of the sodium
        
        
          montmorillonite chart.
        
        
          The clay swell potential can be classified based on the value
        
        
          of the activity coefficient as presented in Table 3.
        
        
          Table 3. The classification of the soil swell potential based on the
        
        
          activity coefficient, after Stanciu 2011
        
        
          Activity coefficient


            C


            A


          Swell potential
        
        
          0 ÷ 0.24
        
        
          low
        
        
          0.25 ÷ 0.49
        
        
          medium
        
        
          0.50 ÷ 0.74
        
        
          high
        
        
          0.75 ÷ 1.00
        
        
          very high
        
        
          The example of this new evaluation procedure for the clay
        
        
          swell potential is presented in Figure 3, where the average
        
        
          charts have been plot for four representative clays: from
        
        
          London, Hubbali, Ankara and Bahlui-Romania, together with
        
        
          the corresponding Romanian kaolinitic and montmorillonitic
        
        
          clays. The values of the normalized area


            n


            A


          and respectively
        
        
          the values of the activity coefficient


            C


            A


          have been calculated for
        
        
          each soil, based on the plotted charts from Figure 3 (Table 4).
        
        
          The resulted swell potential from the classification based on
        
        
          the activity coefficient


            C


            A


          , referring to the diagrams of