1189
Technical Committee 106 /
Comité technique 106
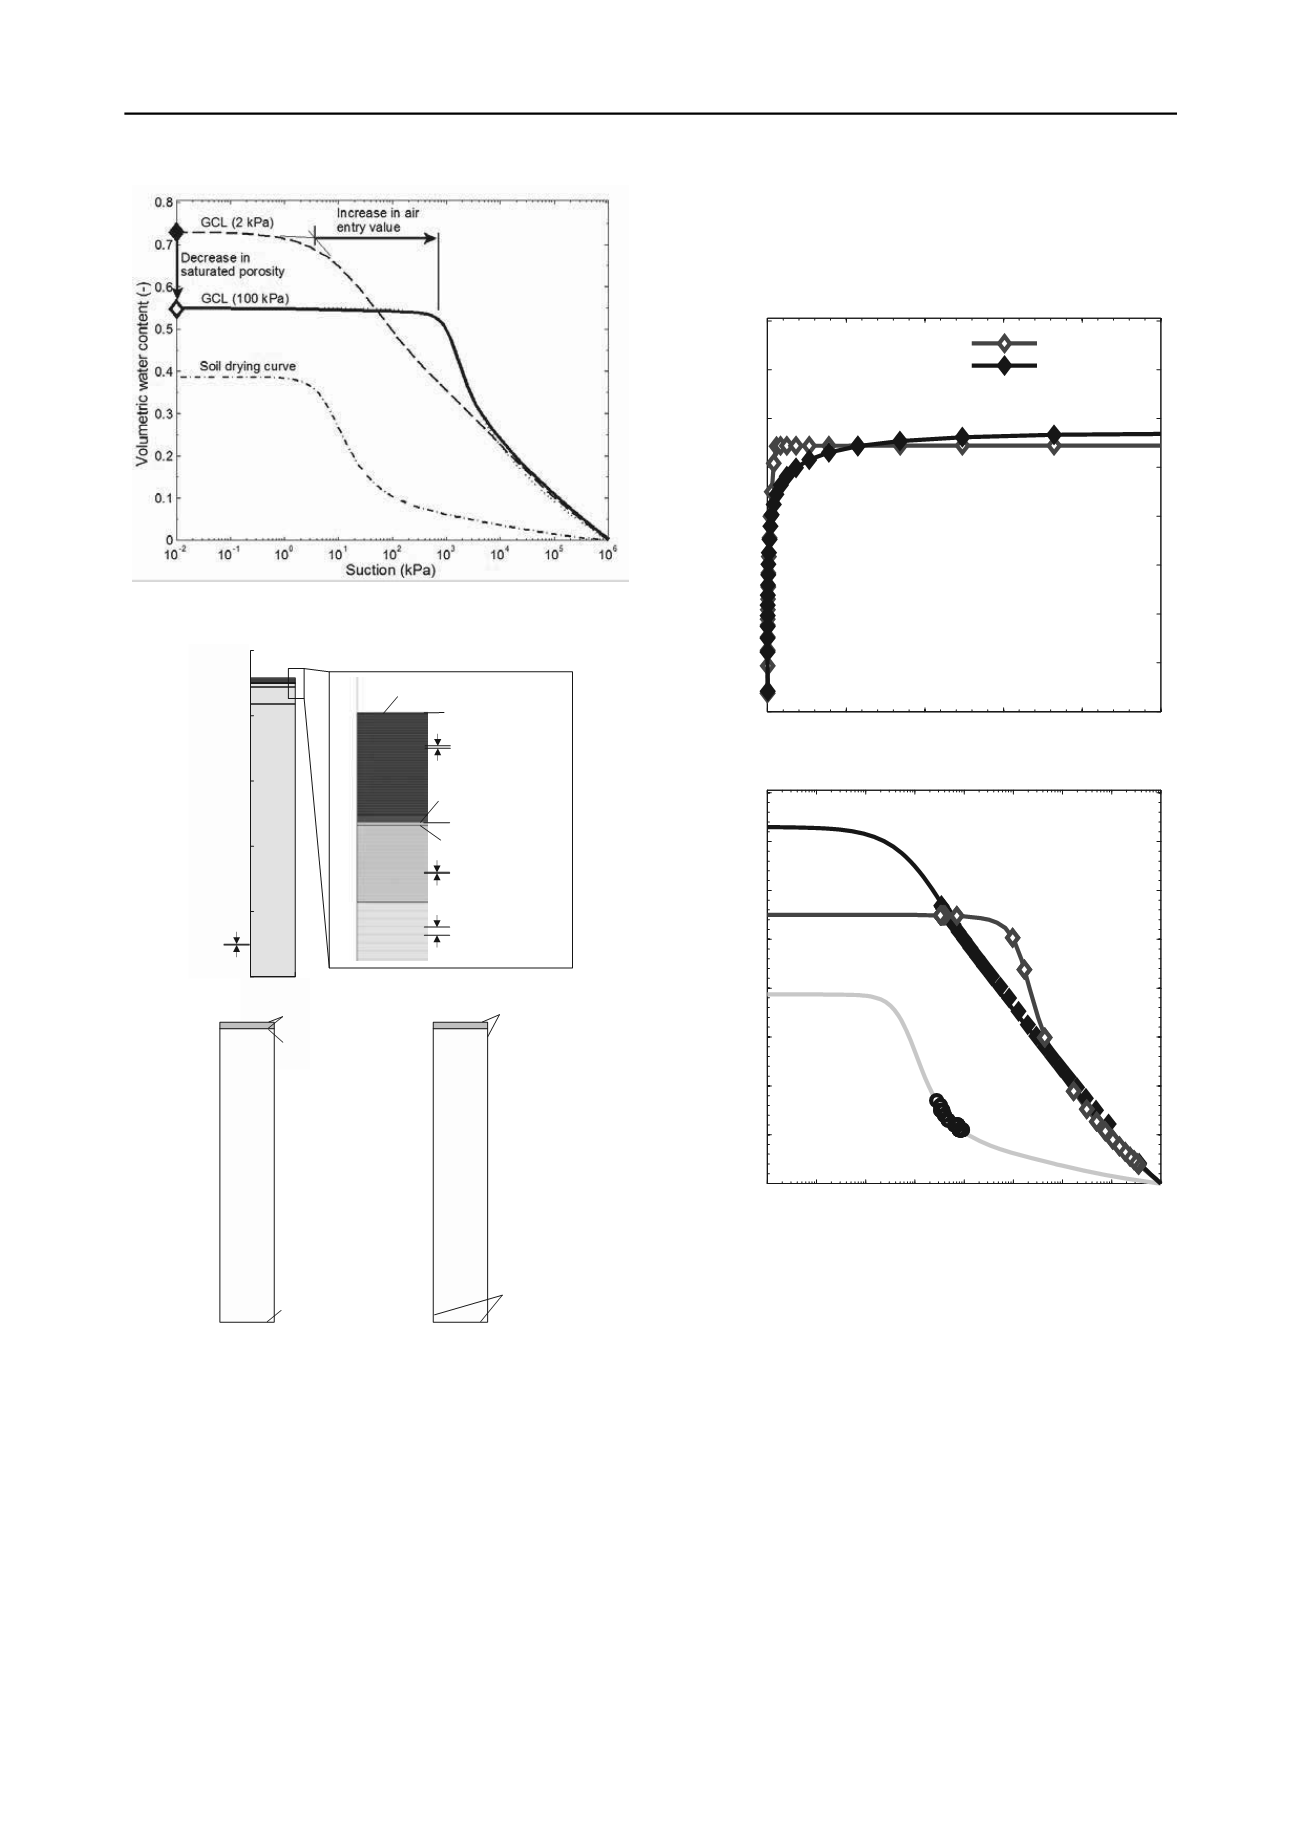
Figure 2. WRCs for the soil as well as the GCL at low and high
confining stress.
0
100
Local Elevation (m ) (x 0.001)
0
100
200
300
400
500
400
500
300
200
Elevation (mm)
100
Soil
0
a)
0.2 mm
Initial GCL suction
Initial soil suction
Initial soil suction
No flow
No flow
b)
El. 457 mm
Initial GCL suction
Initial GCL suction
Initial soil suction
0.6 mm
0.05 mm
2 mm
Initial
conditions
Boundary
conditions
El. 450 mm
Figure 3. Finite element model and boundary conditions.
3 RESULTS
3.1
Typical Model Results – GCL on Soil at GWC=16%
A typical model result is illustrated in Figure 4. The low
confining stress model (Siemens et al. 2012) is also included for
comparison. The foundation soil has an initial suction of 27.6
kPa while the GCL initial suction is set to 362,000 kPa. These
conditions are representative of a foundation soil compacted to
a constant moisture content with the GCL immediately installed
following compaction. In Figure 4a both GCLs start at their
initial low VWC and
increase
to similar equilibrium moisture
content with the higher confining stress model achieving equilibrium in
a shorter duration. From Figure 4b, both GCLs plot along their wetting
curves and the reason for the similar equilibrium VWC is apparent. The
soil provides the suction level to which the GCLs migrate. For the
suction level applied in this model, the GCL WRCs of the 2 kPa and
100kPa cross, which results a similar equilibrium VWC.
0
10
20
30
40
50
0
0.1
0.2
0.3
0.4
0.5
0.6
0.7
0.8
GCL volumetric water content (-)
Time (weeks)
GCL 100kPa
GCL 2kPa
10
-2
10
-1
10
0
10
1
10
2
10
3
10
4
10
5
10
6
0
0.1
0.2
0.3
0.4
0.5
0.6
0.7
0.8
Volumetric water content (-)
Suction (kPa)
GCL 2kPa
GCL 100kPa
Soil
Figure 4. Typical results for foundation soil at 16% gravimetric
moisture content: a) GCL volumetric water content versus time and b)
unsaturated paths plotted on WRCs.
3.2
Model Results
The calculated uptake of moisture during GCL hydration is shown in
Figure 5a in terms of degree of saturation versus time. Relationships are
shown for GCL hydration occurring at either 2kPa or 100 kPa normal
stress for a range
of four foundation soil moisture contents. As
observed by Siemens et al. (2012), the equilibrium degree of
saturation of a GCL increases with foundation moisture content.
The effect of normal stress can be observed by comparing the
hydration behaviour at 2 kPa (closed symbols) and 100 kPa
(open symbols). For each of the four foundation moisture
contents examined in this study, the GCL hydrating at a higher
confining stress was observed to achieve a higher degree of
saturation than the unconfined GCL. The magnitude of this
difference is shown in Figure 5b expressed as the ratio of
Sr
100kPa
/Sr
2kPa
at their equilibrium state of hydration. This data
indicates that although GCLs at both confining stresses will
achieve their near-fully saturated state on the wettest of
foundation soils, at progressively lower foundation moisture


