1180
Proceedings of the 18
th
International Conference on Soil Mechanics and Geotechnical Engineering, Paris 2013
0
50
100
0.001 0.01 0.1
1
10
Grain size (mm)
Percent passing (%)
clay
silt
sand
gravel
100
Material A
Material B
Material C
Material D
Material E
Figure 1. Grain size distribution
0
20
40
1.10
1.20
1.30
1.40
1.50
1.60
1.70
1.80
1.90
2.00
2.10
Water content
w
(%)
Dry density
d
(g/cm
3
)
Material B
Material A
Material C
Material D
Material E
Figure 2. Compaction test results
3 EFFECT OF COMPACTION ON THE MECHANICAL
PROPERTIES OF EMBANKMENT MATERIALS
For 5 types of materials, CU triaxial compression tests were
carried out under Dc and confining pressure shown in Table 1.
The materials D and E are omitted. When preparing the test
specimens, the Dc was adjusted by changing the compaction
energy. After setting the specimen in the triaxial compression
apparatus, the specimen was saturated with de-aired water using
the double-suction method or the back pressure method. Then
isotropic consolidation process was carried out, and when it was
confirmed that the consolidation completed, the undrained
shearing was carried out under constant axial strain rate.
Table 1 Test conditions
Material A
Material B
Material C
Confining
pressure (kPa)
100, 300
50, 100, 150, 300
100, 300
Dc (%)
85, 90, 95, 100 85, 90, 95, 100
90, 95, 100
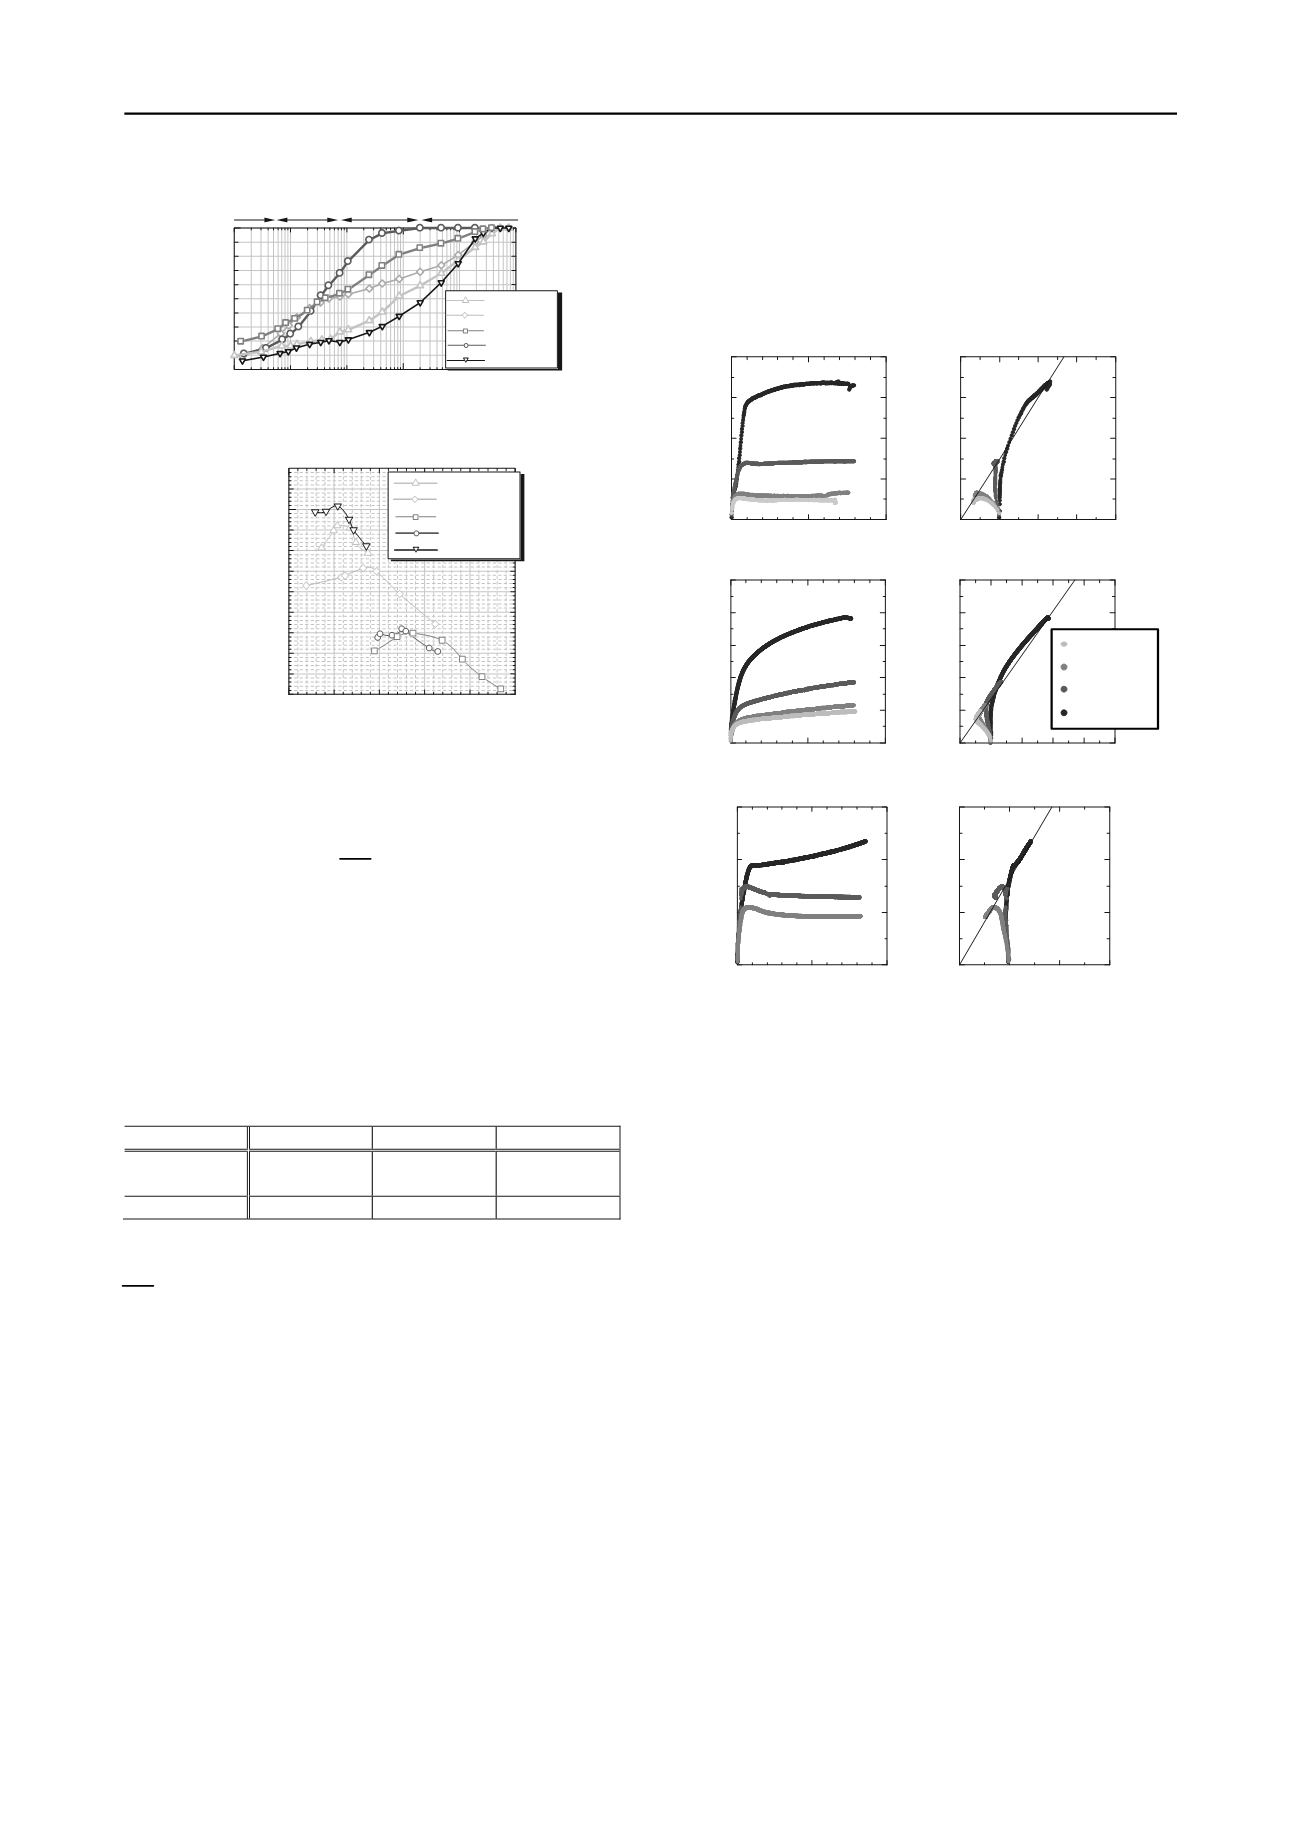
Fig. 3 shows that the deviator stress
q
–
shear strain
s
relationship and
q
- mean effective stress
p’
relationship of the
CU triaxial tests when the confining isotropic consolidation
pressure was 100 kPa for materials A through C. The materials
D and E are omitted. In this section, the increase in
q
during
shearing and maximum of
q
as a result of compaction is referred
to as
‘
compaction effect
’
. For material A at the 85 and 90% of
Dc, an increase in
q
associated with a reduction in
p’
was seen
at the initial shear (shear strain
s
= 0–2%). Thereafter, it
exhibited the mechanical behavior of normally consolidated soil
with both
p’
and
q
in a critical state. At the 95% of Dc, there
was almost no reduction in
p’
observed, and thereafter, both
p’
and
q
exhibited a critical state. At the 100% of Dc, an increase
in
q
associated with the increase in
p’
was seen, and the
maximum of
q
increased greatly. It can be seen that if the Dc of
material A is not large, a compaction effect is not seen. With
material B, an increase in
q
associated with the increase in
p’
was seen at all Dc. Also,
q
increased continuously with the
s
,
and the behavior resembles that of pure sand specimen.
However, as for material A, if the Dc of material B is not large,
a compaction effect is not seen. With material C at the 90 and
95% of Dc, softening behavior was seen associated with plastic
compression as a reduction in
q
associated with a reduction in
p’
. This is behavior seen in soft natural deposited clay. On the
other hand, at the 100% of Dc, the shear behavior changed, with
q
increasing in association with an increase in
p’
, and the
compaction effect was exhibited. However, the compaction
effect was small compared with materials A and B.
0
10
20
0
100
200
300
400
Shear strain
s
(%)
Deviator stress
q
(kPa)
0 100 200 300 400
0
100
200
300
400
Mean effective stress
p'
(kPa)
Deviator stress
q
(kPa)
0
10
20
0
100
200
300
400
500
Shear strain
s
(%)
Deviator stress
q
(kPa)
0 100 200 300 400 500
0
100
200
300
400
500
Mean effective stress
p'
(kPa)
Deviator stress
q
(kPa)
Material A
Material B
MaterialC
0
10
20
0
100
200
300
Shear strain
s
(%)
Deviator stress
q
(kPa)
0
100 200 300
0
100
200
300
Mean effective stress
p'
(kPa)
Deviator stress
q
(kPa)
D
c
=85%
D
c
=90%
D
c
=95%
D
c
=100%
Fig. 3 Undrained triaxial test results
4 INTERPRETATION OF COMPACTION EFFECT
BASED ON SOIL SKELETON STRUCTURE CONCEPT
The SYS Cam-clay model is an elasto-plastic constitutive
model that expresses soil skeleton structure as 3 properties,
structure, overconsolidation, and anisotropy, and describes the
evolution of the soil skeleton structure associated with
development of plastic deformation. The major characteristic of
the SYS Cam-clay model is that it can explain the mechanical
behavior of typical clays and sands, as well as intermediate
soils, based on the rate of change of the evolution of the soil
skeleton structure. In this study, the undrained shear behavior
after compaction for 5 materials is simulated by the SYS Cam-
clay model, and each compaction effect of each specimens can
be interpreted based on soil skeleton structure.
Figs. 4 through 6 show the results of reproducing the
mechanical behaviors of materials A through E using the SYS
Cam-clay model. The top 2 graphs are the stress-strain
relationship and the effective stress path, as in Fig. 3. The
bottom left graph shows the decay of structure associated with
shear deformation, and the bottom right graph shows how loss
of overconsolidation associated with shear deformation
occurred; R* indicates the degree of structure, and the closer R*
is to 1, the lower the structure is, while R indicates reciprocal of
OCR.
The material constants and the initial conditions of the
materials are shown in Tables 3 and 4, respectively. The
calculation results were able to reproduce the test results. In the
case of materials for which a large maximum dry density was


