 
          1188
        
        
          Proceedings of the 18
        
        
          th
        
        
          International Conference on Soil Mechanics and Geotechnical Engineering, Paris 2013
        
        
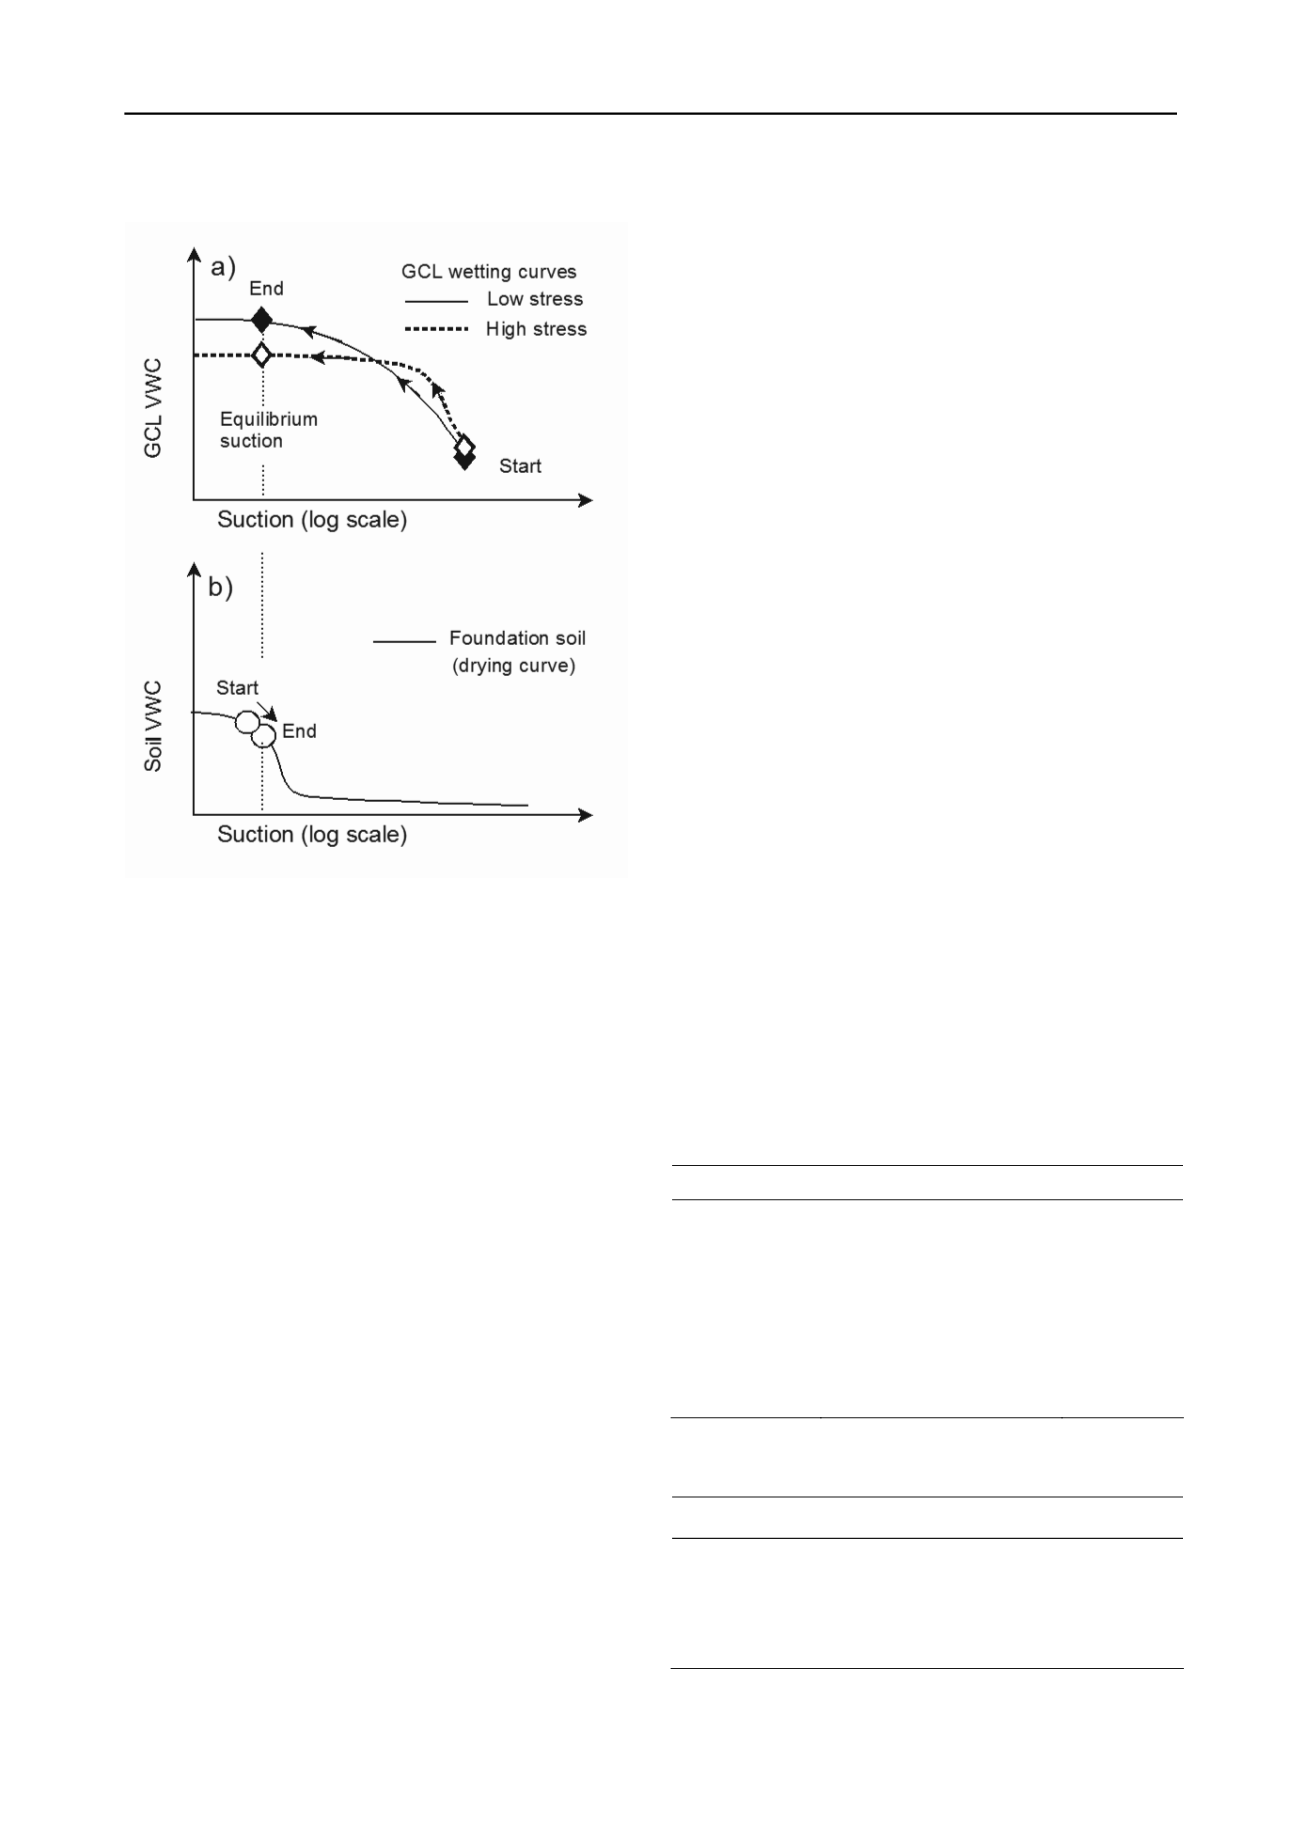
          Figure 1. Unsaturated paths followed during closed hydration of a GCL
        
        
          placed on a foundation soil.
        
        
          Although it is possible for hydration to occur under the
        
        
          conditions previously described, it is also possible that GCL
        
        
          hydration may occur later in time after construction when it is
        
        
          subjected to the higher confining stress associated with waste
        
        
          placement. Based on the effect of higher normal stress on other
        
        
          geomaterials (e.g., Fredlund and Pham 2006) it is hypothesised
        
        
          that confining stress will have a similarly significant impact on
        
        
          the WRC of the GCL and its hydration behaviour. In particular,
        
        
          the increased confining stress will reduce the height of the GCL
        
        
          after it is fully swollen to its saturated moisture content when
        
        
          compared to a similar GCL at a nominal 2 kPa confining stress
        
        
          (Figure 1). A GCL hydrated at high confining stress will
        
        
          therefore have a lower void ratio than a GCL hydrated at low
        
        
          confining stress. This change in the pore structure of the
        
        
          encased bentonite of the more confined GCL will result in a
        
        
          reduction in the GCLs saturated conductivity and an increase in
        
        
          the air entry value of the GCL from the values measured at low
        
        
          confining stress.
        
        
          Despite there being clear indications that confining stress will
        
        
          significantly impact the WRCs of GCLs, there is currently a
        
        
          paucity of WRC data for GCLs at higher confining stresses (the
        
        
          one exception being the two GCL specimens tested by Southen
        
        
          and Rowe, 2007). As a result, the practical impact (if any) of
        
        
          confining stress on the magnitude and rate of hydration is not
        
        
          immediately clear. However, data exists that describes the water
        
        
          retention behaviour of GCLs at low confining stress, and the
        
        
          consolidation behaviour of saturated GCLs to confining stress.
        
        
          In this paper we report a numerical sensitivity analysis to
        
        
          quantify the potential impact higher normal stress could have on
        
        
          the rate of hydration of GCLs to assess whether it is likely to
        
        
          have any practical impact on the hydration behaviour of GCLs
        
        
          assumed in landfill design.
        
        
          2 MODEL DESCRIPTION
        
        
          The effect of confining stress on the moisture uptake of GCLs
        
        
          was investigated for a typical geotextile-encased GCL
        
        
          consisting of a woven cover and a non-woven carrier geotextile
        
        
          with the material properties listed in Table 1. The water
        
        
          retention behaviour of this GCL has been quantified at a low (2
        
        
          kPa) confining stress by Beddoe et al. (2011). The WRC
        
        
          relationship for this GCL and a typical silty-sand foundation
        
        
          soil are listed in Table 2 and plotted in terms of volumetric
        
        
          water content against suction in Figure 2.
        
        
          The material properties for the GCL at high confining stress
        
        
          (Figure 2 and Table 2) were estimated from experimental
        
        
          results.  Southen and Rowe (2007) reported drying WRCs for
        
        
          the GCL at 100 kPa vertical stress, which allowed comparison
        
        
          with the low stress data.  Comparing the fitted curves indicated
        
        
          an increase in the ‘a’ parameter of 100 kPa was necessary to
        
        
          match the results (Table 2).  Beddoe et al. (2011) compared
        
        
          WRCs of various GCLs and reported that at suction values
        
        
          greater than approximately 3000 kPa, the WRCs were similar.
        
        
          Therefore the ‘a’ parameter for the wetting curve was increased
        
        
          by two orders of magnitude as listed in Table 2.  The ‘m’ and
        
        
          ‘n’ parameters were adapted to ensure the WRC agreed with
        
        
          other GCLs for higher suction values.  Lake and Rowe (2000)
        
        
          reported on the compressibility and swell behaviour of GCLs.
        
        
          The results were used to estimate the height and saturated
        
        
          porosity of the hydrated GCL at 100 kPa vertical stress.  Finally
        
        
          conductivity data obtained at various confining stresses (Rowe
        
        
          and Hosney, 2013) was used to estimate the saturated
        
        
          conductivity at 100 kPa.
        
        
          The finite element model (Figure 3) procedure was described in
        
        
          detail earlier (Siemens et al. 2012) and a brief summary will be
        
        
          given here.  The initial moisture conditions are set in the GCL
        
        
          and foundation soil and then the model steps forward in time
        
        
          under closed conditions.  As-manufactured the GCL is at
        
        
          nominal moisture content and approximately 10
        
        
          5
        
        
          kPa suction.
        
        
          The soil is at a suction corresponding to its initial moisture
        
        
          content.  During closed isothermal hydration the foundation soil
        
        
          undergoes minor drying while the GCL approaches the suction
        
        
          boundary condition provided by the soil.  At equilibrium the
        
        
          system achieves a hydrostatic state.
        
        
          Table 1. Properties of GCL1


            Property


            GCL


            Average GCL mass


            per unit area (g/m


            2


            )


            Measured


            Minimum Acceptable Roll Value


          4679
        
        
          3965


            Carrier Geotextile Type


            Mass per unit area (g/m


            2


            )


          W
        
        
          120


            Cover Geotextile


            Type


            Mass per unit area (g/m


            2


            )


          NW
        
        
          240


            Bentonite


            Montmorillonite content (%)


            As-delivered form


          50-55
        
        
          Fine granular


            Structural


            Needle-punched


            Thermally treated


          Yes
        
        
          Yes
        
        
          Table 2. GCL and foundation soil Fredlund and Xing fitting parameters
        
        
          or water retention curves and saturated hydraulic conductivity values.
        
        
          f


            Parameter


            GCL


            2 kPa


            GCL


            100 kPa


            Soil


            Fitting


            parameters


            a (kPa)


            n


            m


            r


            (kPa)


          13.10
        
        
          0.84
        
        
          0.51
        
        
          2559
        
        
          1310
        
        
          3.20
        
        
          0.32
        
        
          2559
        
        
          6.73
        
        
          1.95
        
        
          0.78
        
        
          5856


            Saturated VWC


            (%)


          0.73
        
        
          0.55
        
        
          0.39


            K


            sat


            (m/s)


          1.5x10
        
        
          -11
        
        
          3.5x10
        
        
          -13
        
        
          9.5x10
        
        
          -4