1193
Technical Committee 106 /
Comité technique 106
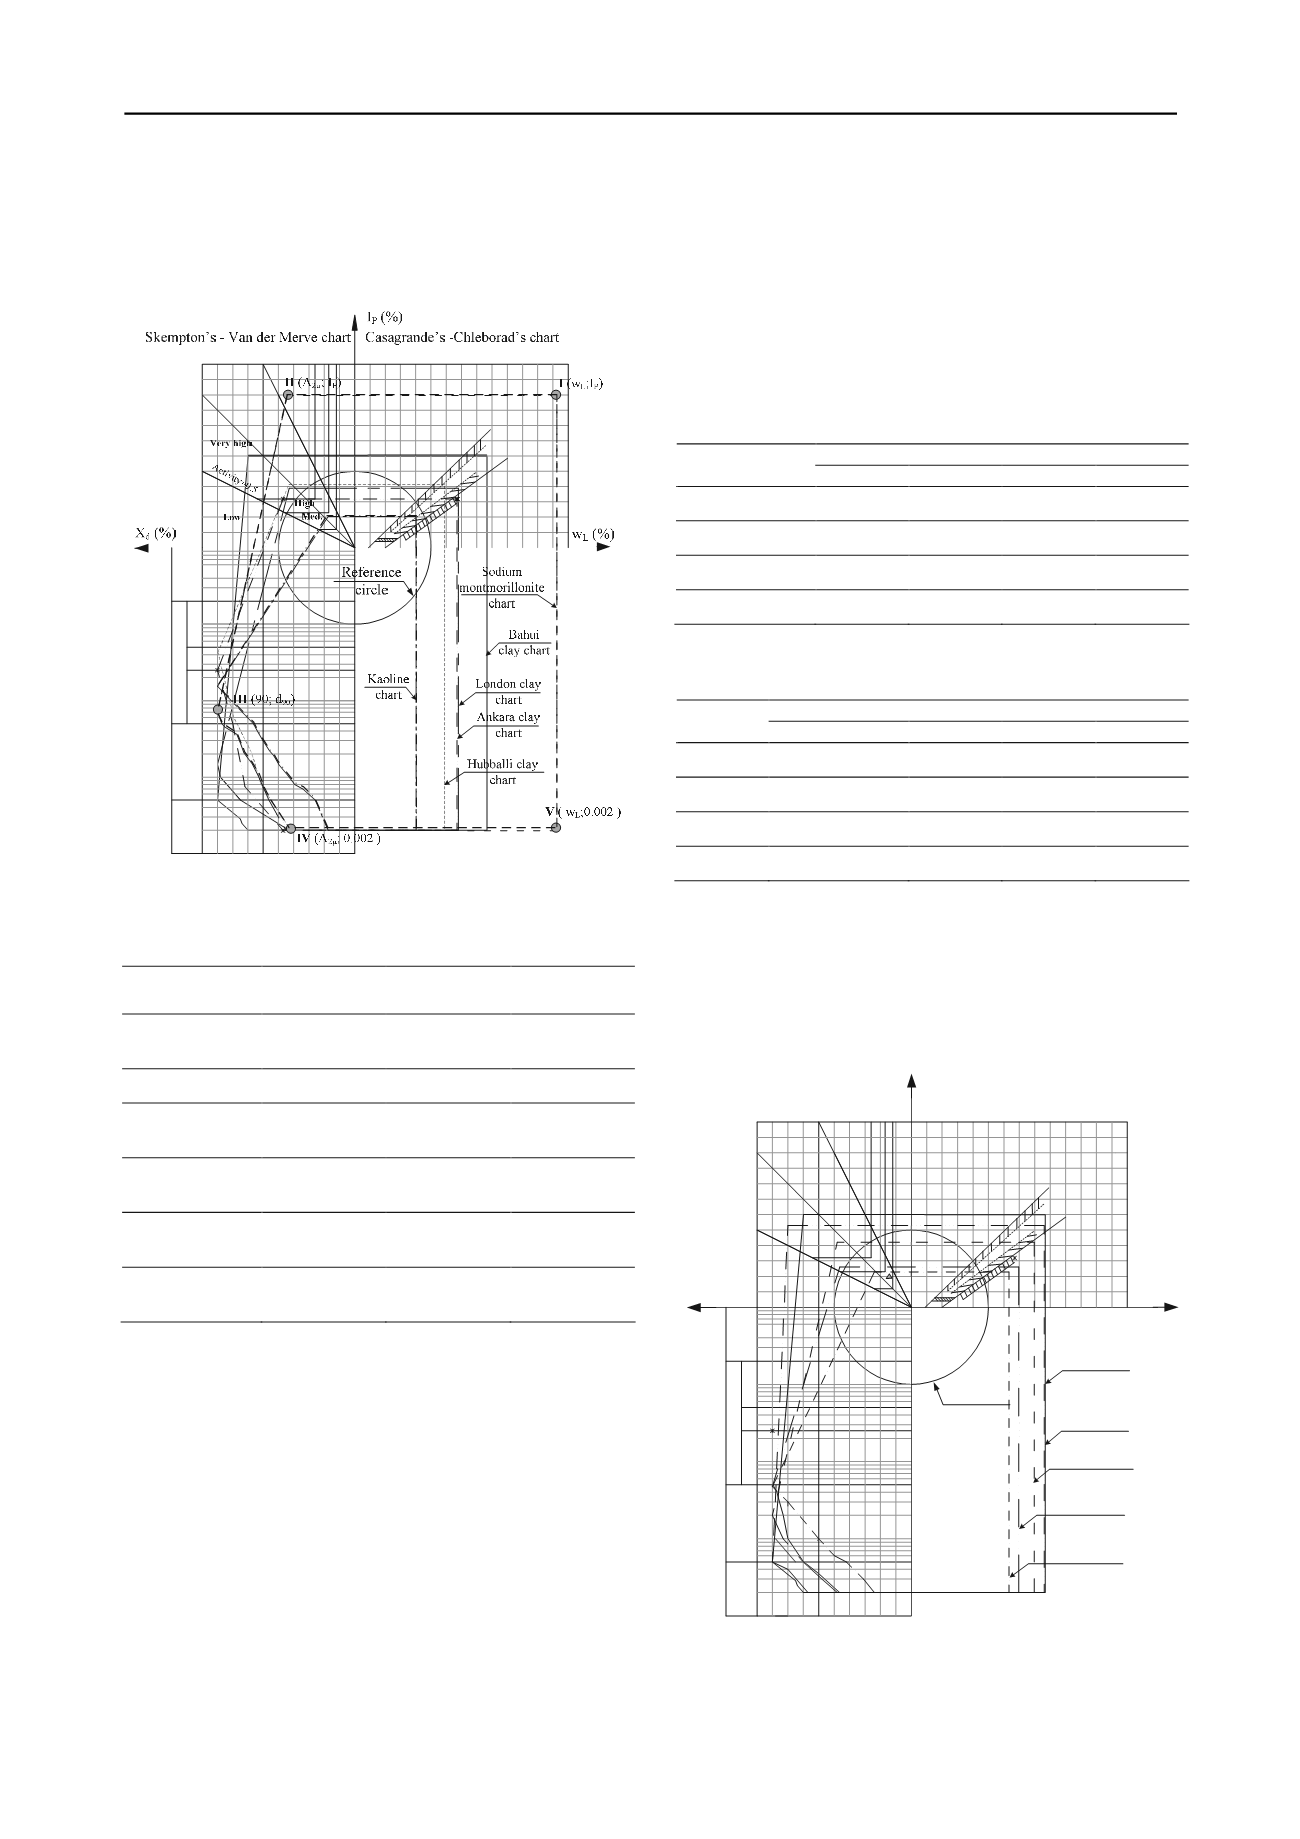
Skempton-Van Der Merwe, Casagrande-Chleborad and the
granulometric curve has been reduced from high to medium for
the London, Hubbali and Ankara clays, and from very high to
high for the Bahlui clay (Tables 2 and 4).
10 20 30 40 50 60 70 80 90 100
10
20
30
40
50
60
80
90
70
100
1.00
0.1
0.01
0.001
0.005
0.05
2
0.25
0.5
10 20 30 40 50 60 70 80 90 100
10 20 30 40 50 60 70 80 90 100
110
120
110120130140
Activity=2.0
Activity=1.0
Granulometric curve
Clay
Silt
Sand
fine
med.
coarse
Gravel
U - line
A - line
Figure 3. The average soil charts of the investigated clay.
Table 4. The classification of the swell potential based on the
activity coefficient (C
A
).
Soil
Normalized
area
n
A
Activity
coefficient
C
A
Swell
potential
Sodium
Montmorillonite
7.212
1
very high
Kaolinit
2.433
0
low
Bahlui clay-
Romania
5.198
0.578
high
London clay-
U.K.
3.868
0.30
medium
Hubballi clay-
India
3.665
0.26
medium
Ankara clay -
Turkey
3.823
0.29
medium
3 THE INFLUENCE OF THE PORTLAND/ECO-CEMENT
STABILIZATION ON THE SWELL POTENTIAL OF
THE BAHLUI CLAY
Many methods exist to reduce the swell-shrinkage potential of
expansive soils to overcome the difficulties in foundation
engineering practice on such sites. One of the most used
methods to reduce the soil swell potential is the chemical
stabilization using Portland cement.
Ecological issues resulting from the end-product pollutants
related to the manufacturing of Portland cement lead to the
development of new chemical binders named eco-cements.
This paper intends, apart from the introduction of the index
(C
A
) characterizing the swell potential, to reduce this potential
by introducing new chemical binders that would provide less
environmental pollution during manufacturing. Thus, a
comparative analysis has been performed regarding the Bahlui
clay stabilization with Portland cement and respectively with
Portland and eco-cement mixture.
During the first testing series, the Portland cement
participation was 2.5 ÷10% from the soil dry mass. For the
second testing series, the previous Portland cement amount was
50% substituted with eco-cement.
The results quantified by the main parameters (w
L
, w
P
, I
P
,
A
2µ
) are presented in Tables 5a and 5b.
Table 5a. The physical properties of the Bahlui clay stabilized with
Portland cement.
Bahlui clay stabilized with Portland cement
Properties
2.5% 5% 7.5% 10%
w
L
(%)
88.3
79.7
69.6
63.2
w
P
(%)
35.5
37.6
44.5
40.3
I
P
(%)
52.8
42.1
25.1
22.9
A
2µ
(%)
78
51
47
26
Table 5b. The physical properties of the Bahlui clay stabilized with
Portland and eco-cement mix.
Bahlui clay stabilized with Portland and eco-cement
Properties
2.5% 5% 7.5% 10%
w
L
(%)
86.2
75.1
75
65.6
w
P
(%)
44.32
44.72
43.16
43
I
P
(%)
41.88
30.38
31.84
22.6
A
2µ
(%)
63
55
48
26
The charts of the stabilized Bahlui clay with Portland
cement (Figure 4) and with the mix (50% Portland cement and
50% eco-cement) (Figure 5) were plotted based on the obtained
results.
The new material structure will display a reduced swell
potential determined based on the activity coefficient for a 10%
Portland cement mix (Table 6a).
10 20 30 40 50 60 70 80 90 100
10
20
30
40
50
60
80
90
70
100
1.00
0.1
0.01
0.001
0.005
0.05
2
0.25
0.5
10 20 30 40 50 60 70 80 90 100
10 20 30 40 50 60 70 80 90 100
110
120
110120130140
w
L
(%)
X
d
(%)
I
P
(%)
Casagrande’s
-
Chleborad’s chart
Skempton’s
- Van der Merve chart
Activity=2.0
Activity=1.0
Activity=0.5
Very high
High
Low
Med.
U - line
A - line
Reference
circle
Granulometric curve
Clay
Silt
Sand
fine
med.
coarse
Gravel
natural
Bahui clay
Bahui clay+
2.5% CP
Bahui clay+
5.0% CP
Bahui clay+
7.5% CP
Bahui clay+
10% CP
Figure 4. The chart of the Bahlui clay stabilized in various percentages
with Portland cement.
The activity coefficients have been calculated using the
plotted charts for the stabilization with Portland cement (Table


