 
          1198
        
        
          Proceedings of the 18
        
        
          th
        
        
          International Conference on Soil Mechanics and Geotechnical Engineering, Paris 2013
        
        
          using the dynamic state moisture distribution model is shown in
        
        
          Fig. 10.
        
        
          5.2


            Assumption of unsaturated hydraulic conductivity


          5 MOISTURE DISTRIBUTION IN RESPONSE TO
        
        
          HYDRAULIC PROPERTIES
        
        
          5.1


            Moisture characteristic curve


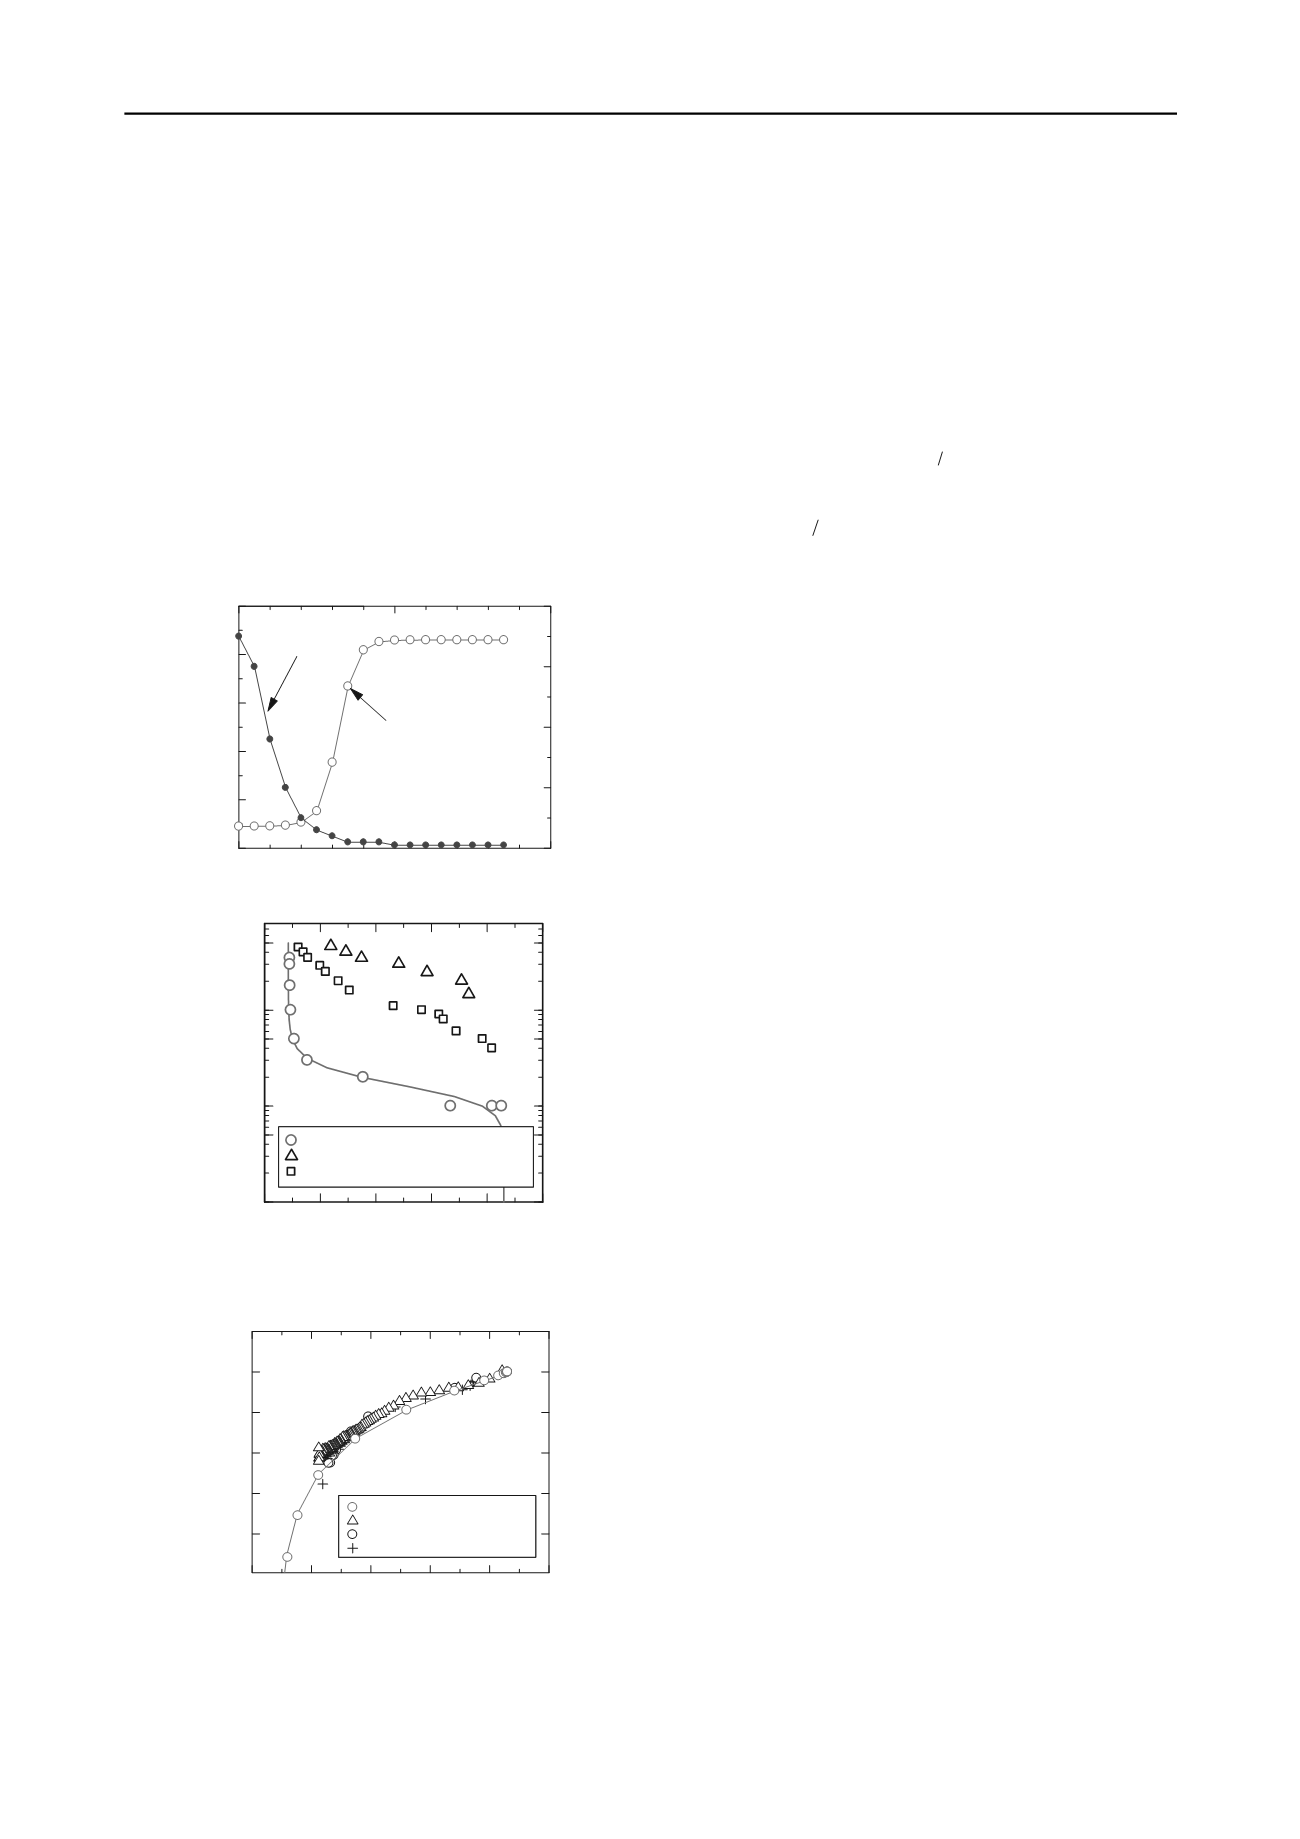
          Fig. 11 shows the relationship between the water volume
        
        
          presumed from the pressure head and moisture distribution
        
        
          model for a depth of 50 mm, which is installing the tensiometer.
        
        
          Moreover, what showed the relation of the moisture
        
        
          characteristic from these is shown in Fig. 11. The moisture
        
        
          characteristic curve obtained in the laboratory experiments for
        
        
          reference is also shown in Fig. 12. Compared to the laboratory
        
        
          experiments, the absolute value of the pressure head was low. In
        
        
          order to carry out load of the water pressure of 100 mm to a
        
        
          permeation surface with the start of test, the air below a
        
        
          The parameters of the van Genuchten model can be estimated
        
        
          by our moisture characteristic curve of Fig. 12. The unsaturated
        
        
          hydraulic conductivity obtained using the Mualem model and
        
        
          the estimated parameters is shown in Fig. 13. The result of the
        
        
          proposed method was in agreement with other laboratory
        
        
          experimental results. By using the van Genuchten and Mualem
        
        
          models, since parameter n of the moisture characteristic curve is
        
        
          used, as shown in an Eq.7, it is considered that the slope of the
        
        
          moisture characteristic curve was evaluated correctly.


            n n


            nn


            e


            e


            sat


            unsat


            S


            S k


            k


          /11 )1 (
        
        
          5.0
        
        
          11


          (7)
        
        
          where,


            r


            s


            s


            e


            S


          ,


            k


            unsat


          is the hydraulic conductivity of
        
        
          unsaturated soil,


            k


            sat


          is the hydraulic conductivity of saturated
        
        
          soil, and


            n


          is the parameter of the Genuchten and Mualem
        
        
          model.
        
        
          0
        
        
          100
        
        
          200
        
        
          0
        
        
          0.1
        
        
          0.2
        
        
          0.3
        
        
          0.4
        
        
          0.5
        
        
          0
        
        
          10
        
        
          20
        
        
          30
        
        
          40
        
        
          Volumetric water content,
        
        
          θ
        
        
          Pressure head |h
        
        
          p
        
        
          |,
        
        
          (cm)
        
        
          Volmetric water content
        
        
          (Estimated)
        
        
          Pressure head
        
        
          (Observed )
        
        
          Elapsed time, t (sec)
        
        
          6 CONCLUSIONS
        
        
          The experimental results of the permeation tests and dynamic
        
        
          state soil moisture distribution model, the following conclusions
        
        
          could be drawn:
        
        
          1) When there is no volume change, not only the wetting front
        
        
          but the depth of the saturation front is proportional to the
        
        
          square root of time.
        
        
          2) The measurement values obtained for the amount of
        
        
          infiltration by permeation and the pore pressure of one point,
        
        
          can be used to calculate the parameters of a dynamic state
        
        
          moisture distribution model.
        
        
          Figure 11.  Presumed data from experimental results.
        
        
          3) Hydraulic properties of the unsaturated foundation could be
        
        
          evaluated using the observed value of the presumed moisture
        
        
          distribution and pore pressure.
        
        
          0 0.1 0.2 0.3 0.4 0.5
        
        
          10
        
        
          -1
        
        
          10
        
        
          0
        
        
          10
        
        
          1
        
        
          Estimated value(Invasion process)
        
        
          Pressure method(Invasion process)
        
        
          Pressure method(Drying process)
        
        
          Pressure head |h
        
        
          p
        
        
          |,  (cm)
        
        
          Volumetric water content,
        
        
          θ
        
        
          4) The pressure head of the moisture characteristic curve was
        
        
          affected by gap air and shifted to positive pressure; this needs
        
        
          to be improved in the future.
        
        
          7 ACKNOWLEDGEMENTS
        
        
          The authors would like to acknowledge Ikuya Sasa, who
        
        
          conducted the experiments presented in this paper. This work
        
        
          was supported by JSPS KAKENHI Grant Number 22360189.
        
        
          8 REFERENCES
        
        
          Yong, R.N. and Warkentin, B. P. 1975.  Soil Properties and behavior,
        
        
          155-163, Elevier Scientific Publishing Co.
        
        
          Figure 12. Data inferred from experimental results.
        
        
          Sugii, T. 2005.Modeling of soil moisture profile during infiltration into
        
        
          vadose zone, Proceedings of 16th International Conference on Soil
        
        
          Mechanics and Geotechnical Engineering, pp.2449-2452.
        
        
          0
        
        
          0.1 0.2 0.3 0.4 0.5
        
        
          10
        
        
          -8
        
        
          10
        
        
          -7
        
        
          10
        
        
          -6
        
        
          10
        
        
          -5
        
        
          10
        
        
          -4
        
        
          10
        
        
          -3
        
        
          Estimated value
        
        
          AMP method (Sugii(2000))
        
        
          Pressure method
        
        
          Instanteneous profile method
        
        
          Volumatric water content,
        
        
          θ
        
        
          Hydraulic conductivity, k
        
        
          w
        
        
          (m/s)
        
        
          Sugii,T., Yamada,K. and Uemura,M. 2000. Measuring hydraulic
        
        
          properties of unsaturated soils with unsteady method, Proc. Of the
        
        
          2nd Asian Conference on Unsaturated Soils, 439-444.
        
        
          Richards, S. and Weeks, L. 1953. Capillary conductivity values from
        
        
          moisture yield and tension measurements on soil columns, Soil Sci.
        
        
          Am. Proc., 17, pp.206-209.
        
        
          Watson, K. K. 1966 . An instantaneous profile method for determining
        
        
          the hydraulic conductivity unsaturated porous materials, Water
        
        
          Resour. Res., Vol.2, pp.709-715.
        
        
          van Genuchten, M.Th. 1980  A closed-form Equation for Predicting the
        
        
          Hydraulic Conductivity of Unsaturated Soils. Soil Sci Am. J.44
        
        
          pp.892-893
        
        
          .
        
        
          Figure 13.  Presumed hydraulic conductivity of unsaturated soil.
        
        
          permeation surface is confined. Therefore, it is considered that
        
        
          the pore air pressure became higher than the atmospheric
        
        
          pressure.
        
        
          Finally, it is measured lower than actual pore water
        
        
          pressure.