1200
Proceedings of the 18
th
International Conference on Soil Mechanics and Geotechnical Engineering, Paris 2013
electrode resistivity systems (e.g. Damasceno et al., 2009) has
triggered rapid and efficient data acquisition of resistivity
measurements to address a wide range of applications such as
water content estimations.
A number of authors have demonstrated an explicit
relationship between resistivity and water content. Shah and
Singh (2005) proposed 'a generalized Archie's Law' as:
m
w
(2)
Where
θ
is the soil water content (volumetric),
w
is a fitting
parameter related to pore water resistivity, and
m
is a
dimensionless constant.
2.2
The multi-electrode resistivity system
A multi-electrode resistivity system is based on the traditional
four-electrode principle combined with automatic multiplexing
for a larger number of electrodes (Damasceno et al., 2009). The
system described here consists of: a constant current power
source, a switching system and acquisition software. A 30V/2A
programmable DC power supply type EL302P and MSL
Datascan logger type 7220, both connected to a PC via RS 232
interface, were used to measure the voltage and log the current
by measuring the voltage drop across a 1 Ω high precision shunt
resistor. A similar approach has been adopted in commercial
equipment e.g. MPT/ERT 2004 system from Multi-Phase
Technologies, LLC (MPT) (LaBrecque and Daily, 2008).
Windows based data acquisition and control software named
Resist has been developed to integrate the hardware and to
control the data collection process. The user can set the current
injected into the soil specimen and read the current, the voltage
drop, and hence the resistance in a fully automatic procedure.
To prevent electrode polarization (LaBrecque and Daily, 2008)
short current pulses are used and an average reading (i.e.
stacking) of a number of normal and reverse polarity readings
are automatically acquired.
The aim of the laboratory testing described here was to
check the data quality of the developed system. A wide range of
high precision reference resistors (ASTM G57, 2006) was used
to calibrate the system, and the measurements were compared
with those acquired with a Terrameter SAS 300C (ABEM)
system. The results are reported in Table 1. It can be seen that
Resist gives better results than the commercial Terrameter with
a maximum error of 0.8%.
Table 1. A comparison between Terrameter SAS 300C system and
Resist reading for a range of reference resistors
SAS 300 Terrameter
Resist
Reference
Resistor
(Ohm)
Average
Reading
(Ohm)
Percentage
Error
(%)
Average
reading
(Ohm)
Percentage
Error
(%)
10
9.9
1.00
10.0
0.00
56
56.1
0.18
56.3
0.54
100
98.0
2.00
99.2
0.80
120
119.3
0.58
120.2
0.17
150
149.0
0.67
150.1
0.07
220
217.0
1.36
218.9
0.50
270
268.0
0.74
270.5
0.19
370
368.0
0.54
368.9
0.30
490
486.0
0.82
489.0
0.20
590
585.0
0.85
589.1
0.15
1000
996.0
0.40
998.4
0.16
1120
1118.0
0.18
1118.4
0.14
1220
1217.0
0.24
1215.9
0.33
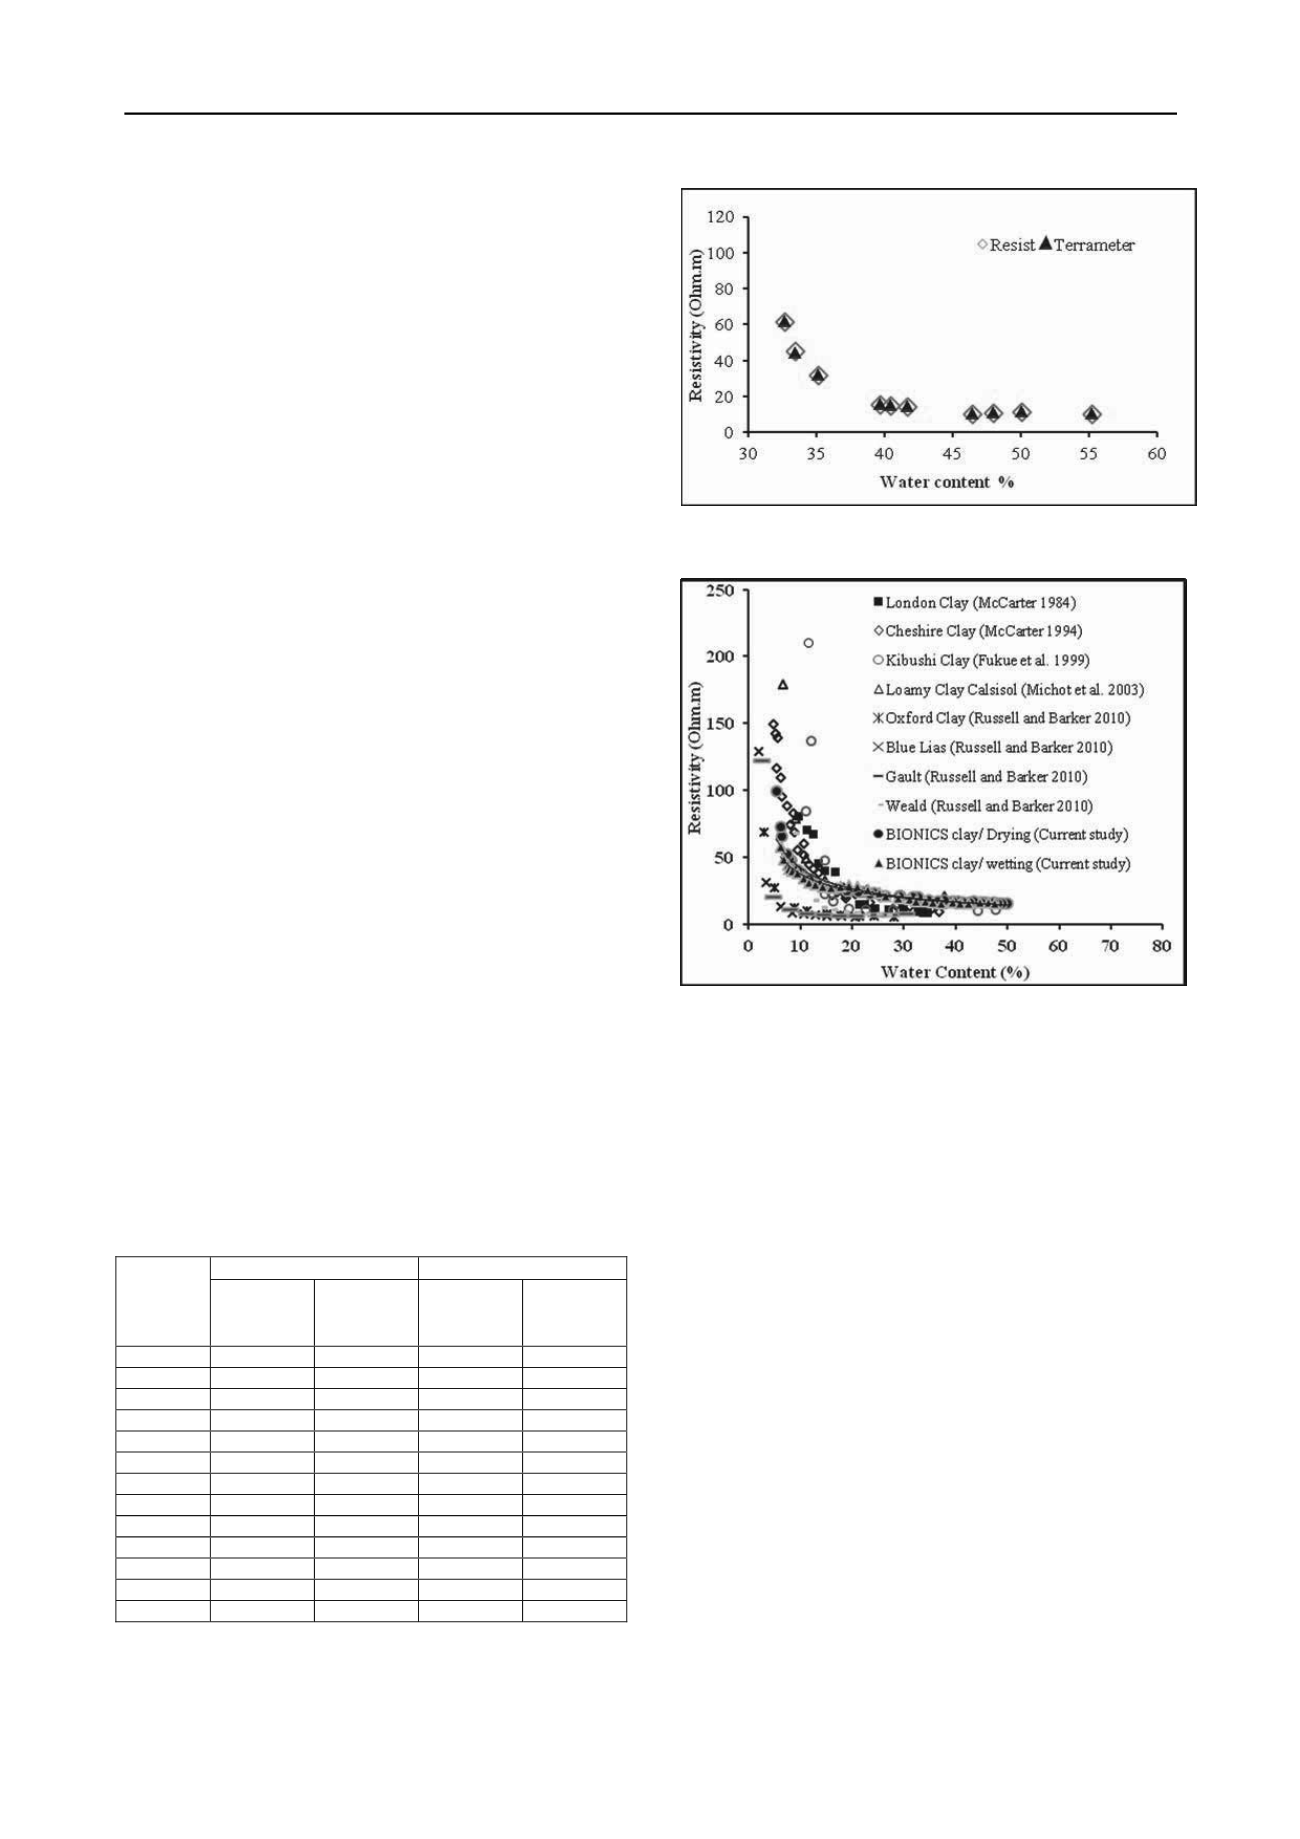
Figure 1. Resistivity-gravimetric water content relationship of a kaolin
specimen
Figure 2. Resistivity-water content relationships of BIONICS clay and
different clays reported in the literature
A resistivity box (ASTM G57, 2006) was constructed to
measure resistivity of a Kaolin specimen during drying. A good
comparison between Terrameter SAS 300C and Resist readings
is shown in Figure 1 with a percentage difference less than
1.59%.
The developed system has been used to investigate drying
and wetting of sandy clay sampled from the BIONICS project
(Mendes, 2011). The soil is classified as being intermediate
plasticity with Liquid Limit (43.3%), Plastic Limit (23.7%),
Plasticity Index of 19.6, and a Liquidity Index of -0.05. A
resistivity probe based on a square arrangement (Habberjam and
Watkins, 1967) with inter-electrode spacing of 15mm was
constructed to monitor water content changes of a specimen
subjected to controlled drying and wetting procedures. Figure 2
shows the drying and wetting curve compared to different clays
reported in the literature
.
The experimental data followed the power law function
reported in the literature (Calamita et al. 2012), within the
typical range of clay resistivity (1-100) Ohm.m (e.g. Loke
2011). As resistivity is mainly controlled by water content, in
both drying or wetting the resistivity is relatively low at high
water content (the capillary and gravitational water ranges) and
high at low water content (the range of adsorbed, lm, and lm-
capillary water) (Pozdnyakov et al., 2006). However, the rate of
the resistivity changes is higher at low water content due to air
replacement of water in the pores. The well defined resistivity-
water content relationship obtained in this study with high
correlation coefficient 0.945 and 0.966 for drying and wetting
respectively, suggest that it can be used to calibrate resistivity
against water content (Muñoz-Castelblanc et al., 2011) and to
estimate in situ water content changes (Calamita et al., 2012).


