1201
Technical Committee 106 /
Comité technique 106
Although resistivity provides an excellent technique for non-
intrusive measurement of the spatiotemporal variation in water
content on a large scale in the field, it can also be used to
provide localised measurements in the laboratory (e.g. Muñoz-
Castelblanc et al., 2011). The system described here has also
been adopted for use in large-scale laboratory lysimeters
(Asquith et al., 2012).
3 TIME DOMAIN REFLECTOMETRY
The TDR technique (Topp et al., 1980) is a method to measure
soil water in hydrological and geotechnical testing, by
measuring the soil bulk permittivity or dielectric constant that
determines the velocity of an electromagnetic wave transmitted
through the soil via a TDR probe (Tarantino et al., 2008). Since
the dielectric constant of water (
K
=80) is larger than air (
K
=1)
and soil constituents (
K
= 2-5), the bulk permittivity is mainly
governed by soil water content. To estimate water content from
the dielectric constant,
K
, the empirical equation of Topp et al.
(1980) is commonly used.
3.1
Coiled TDR
In geotechnical testing it would be hugely beneficial to have a
device that is capable of simultaneous measurements of soil
water content and pore water pressure at the same position. To
achieve this, a coiled TDR device was developed that could be
wound around a high suction tensiometer. The tensiometer was
developed at Durham University (Lourenço et al., 2006) and is
capable of measuring negative pore water pressures down to
-2 MPa.
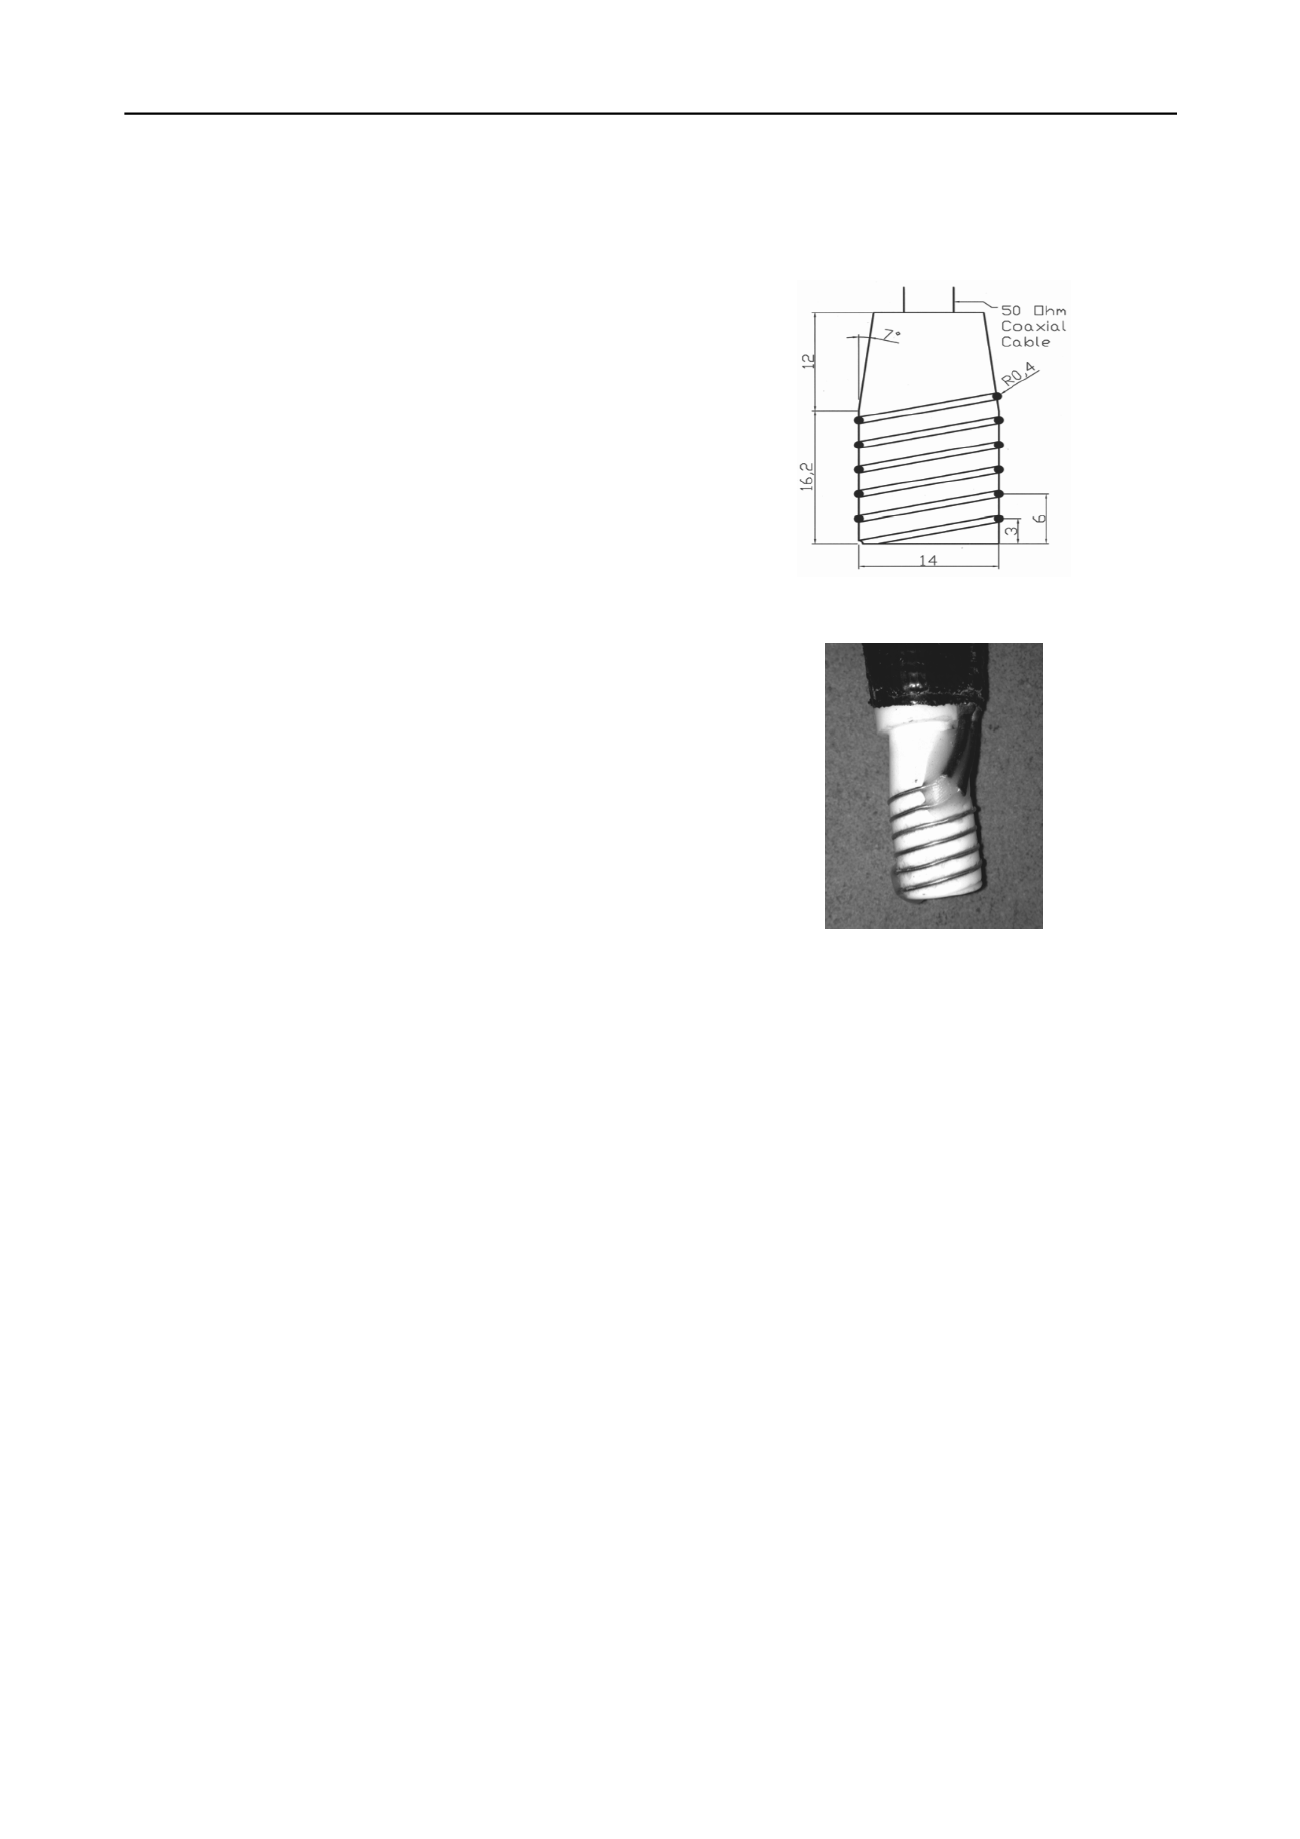
A double pronged TDR device was constructed by coiling
copper wire around the insulated stainless steel housing of the
tensiometer (Figure 3). A second device was also constructed
using an impermeable ceramic tensiometer housing (Figure 4).
The ceramic chosen was an impermeable Macor machinable
glass ceramic, with a Young’s Modulus of 66.9 GPa and a
compressive strength of 345 MPa.
Each housing had two helixes (0.8 mm wide, 0.4 mm deep)
cut into them at a pitch of 6 mm. This was so that the TDR
prongs sat 3 mm apart as shown in Figure 3. This ensured that
the probe diameter to spacing ratio was within the
recommended region given by Noborio (2001) and Knight
(1992), thus promoting an even distribution of electric field
between the TDR prongs. The stainless steel body was insulated
using five coatings of an insulating varnish.
The devices were tested alongside a conventional three-
pronged TDR probe in three different soils (Leighton Buzzard
sand, Birtley Clay and a very loose organic soil) over a range of
known water contents.
The device could be simply calibrated based on the
measured dielectric constant
K
a
for known soil water contents
.
However, to better understand the effect of coiling the probe
around a steel or ceramic body and to take account of the fact
that the coiled TDR is measuring the effect of the steel or
ceramic housing that it is wound around, as well as the
properties of the soil surrounding it, a mixing model approach
(Roth et al., 1990) was investigated for interpreting the data.
The aim was to split the apparent dielectric constant
K
a
into two
parts, the dielectric constant of the tensiometer housing
K
house
and the dielectric constant of the soil
K
soil
.
Ferré et al. (1998) showed that for the special case where the
rod surface was divided equally between two materials, the
apparent dielectric constant could be described as:
K
a
= 0.5
K
1
+ 0.5
K
2
(3)
where
K
1
and
K
2
are the dielectric constants of the two
surrounding materials.
The helix which seats the TDR probe was designed so that
half of each prong was exposed to the soil. Therefore
K
1
can be
replaced by
K
house
and
K
2
by
K
soil
. By measuring
K
a
,
K
soil
was
then interpreted by rearranging eq. (3) and finding a suitable
value of
K
house
.
Figure 3. Schematic of tensiometer housing and coiled TDR
(dimensions in mm)
Figure 4. Coiled TDR constructed around a ceramic tensiometer body
The manufacturer’s specifications give the dielectric
constant of the ceramic to be 6.03 at 1 kHz and 5.67 at 8.5 GHz.
Since the TDR bandwidth extends to around 1.5 GHz, a value
of 6.0 was taken as the first approximation of
K
house
. This value,
however, still caused large underestimations of volumetric
water content,
θ
. By using trial and error and measuring the
standard deviation of the difference between the actual
dielectric constant calculated from
θ
, and
K
soil
obtained from the
mixing model, the best value of
K
house
was found to be 3.5.
This value of
K
house
for the ceramic was significantly lower
than the dielectric constant given by the manufacturer. Adopting
a
K
house
value of 6.0 would be assuming that there was a perfect
contact between the copper wire and the ceramic within the
helix. However, as the grooves cut into the ceramic were not
perfectly smooth and some tension in the prongs was lost when
gluing them in place, this could introduce a small air gap
between the copper wire and the ceramic body, changing the
effect that the housing would have on the measured result.
For the stainless steel probe, using the same approach gave
the optimal value of
K
house
to be 2.65. In the case of the stainless
steel body, the dielectric constant of the insulation was
unknown so comparisons could not be made.
The results of applying the simplified mixing model to the
data (using
K
house
as 2.65) are shown in Figure 5. It can be seen
that the results are slightly underestimated for clay and
overestimated for sand, compared to the readings obtained from
the conventional 3-prong TDR device.
It is likely that the higher values for sand are due to poor
contact with the probe. If these higher values for sand were


