1173
Technical Committee 106 /
Comité technique 106
3 TEST RESULTS
3.1 Comparison of water flow characteristics
Three different micro-porous membranes (Micro-porous
membrane No. 2, 3 and 4) in Table 1 were used to investigate
the influence of air entry value on equilibrium time. These
micro-porous membranes had different air entry values of
100 kPa, 60 kPa and 40 kPa. The silt was prepared in the steel
mold, with an initial degree of saturation close to 100 %. An air
pressure of 25 kPa was applied to the upper surface of the soil
specimen. The soil water passed through the micro-porous
membrane and drained into the burette. Figure 4 shows changes
of gravimetric water content with time. Once water flow
commenced, the gravimetric water content decreased rapidly.
The water content reached equilibrium in about 2 minutes.
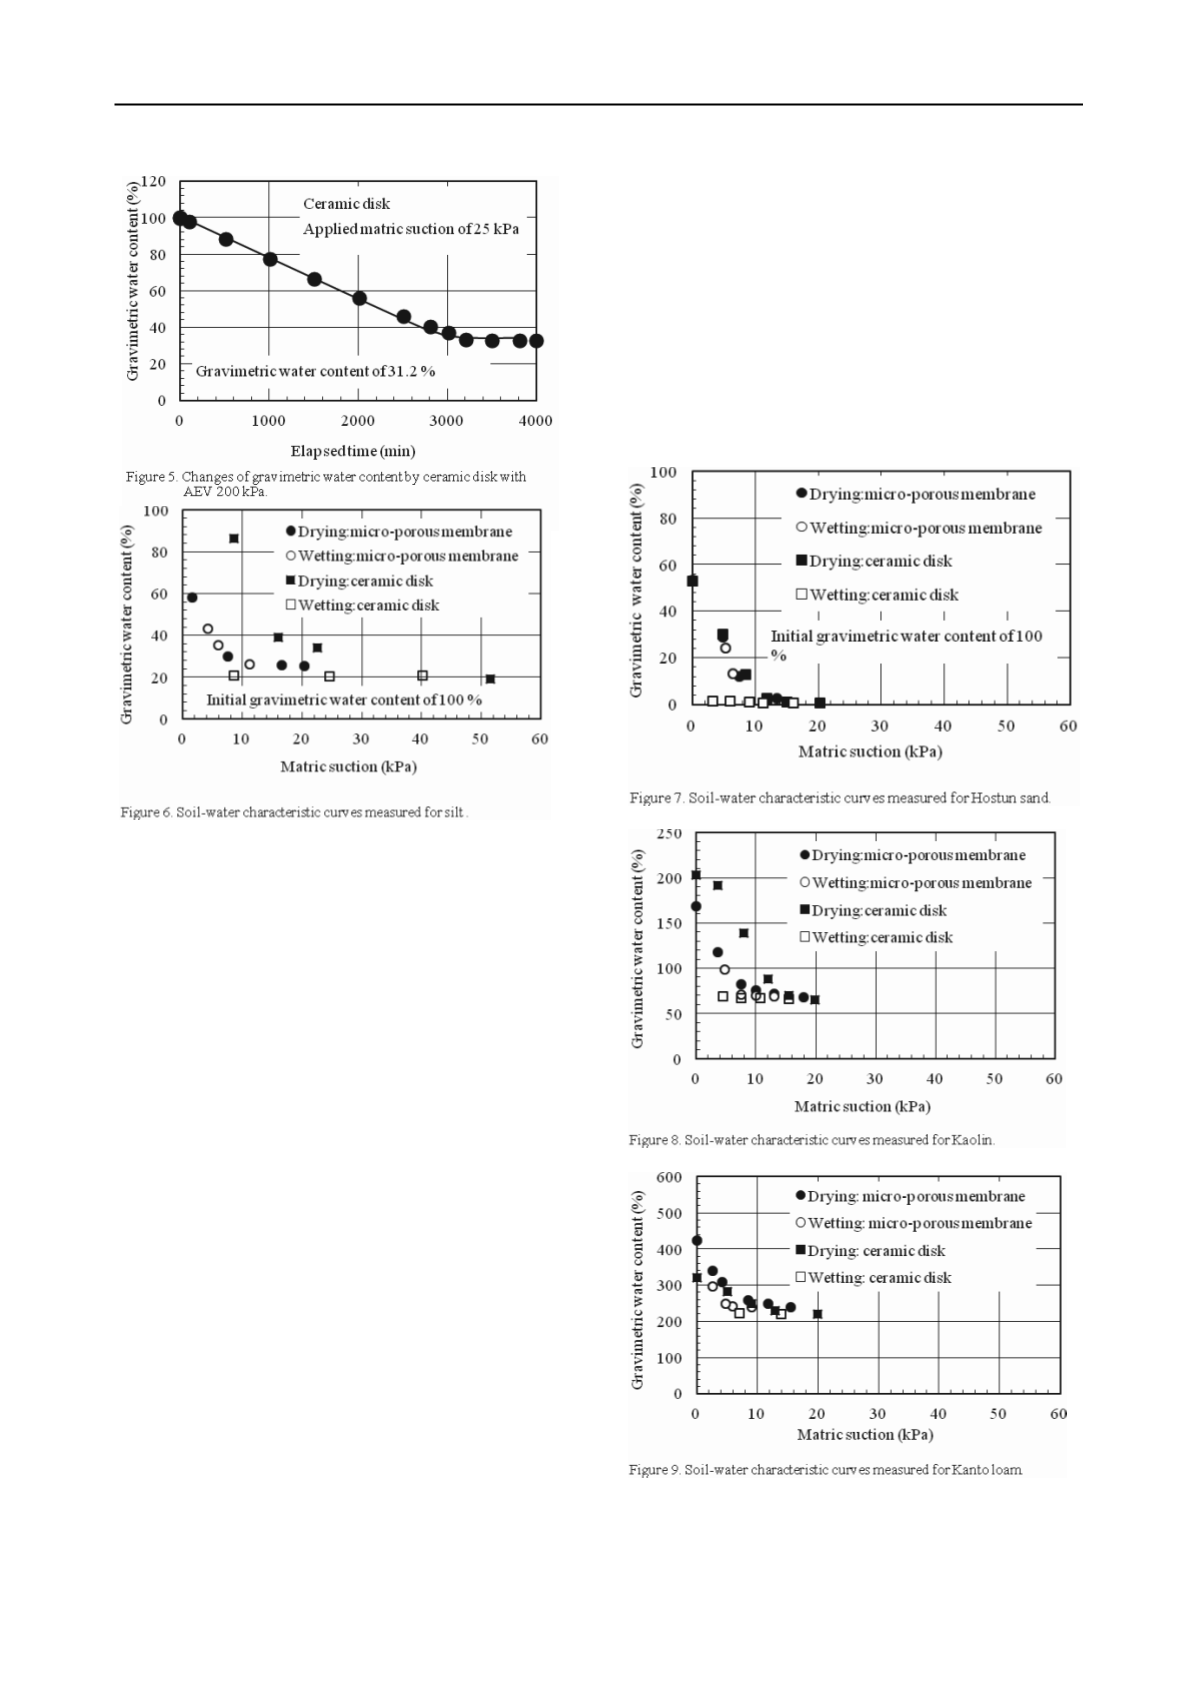
Similar tests were conducted using the saturated high air
entry ceramic disks. Figure 5 shows the changes in water
content with time for the ceramic disks with AEV of 200 kPa.
The rate of water content decrease was slower as compared to
that of the micro-porous membrane. The equilibrium time
appears to occur around 3000 minutes. The test results show
that considerably more time is required to achieve equilibrium
when using the high air entry ceramic disks.
There are differences in the soil-water characteristic curves
obtained from the micro-porous membrane and those from the
ceramic disk for all soil specimens. On the drying paths,
the
soil-water characteristic curve obtained from the micro-porous
membrane was lower than that obtained from the ceramic disk.
The water content using the micro-porous membrane is less
than that measured using the ceramic disk. The water content as
measured using the ceramic disk was considerably larger as
compared to that obtained from the micro-porous membrane. It
can be observed that absorption on the wetting path would result
in a significantly less water content when the ceramic disk was
used. Water appeared to be able to pass through the micro-
porous membrane well, increasing the water content of the soil
specimen during the decrease in matric suction. The wetting
soil-water characteristic curve is located close to the drying soil-
water characteristic curve. The soil-water characteristic curves
obtained from the micro-porous membrane showed less
hysteresis as compared to those measured using the ceramic
disk in the traditional testing method.
3.2 Soil-water characteristic curves for different soil materials
Soil-water characteristic curves for different soil materials as
measured using both the micro-porous membrane and the
ceramic disk with AEV of 500 kPa are shown in Figs. 6 to 10.
3.3 Soil-water characteristic curves for different soil
materials
Soil-water characteristic curves for different soil materials as
measured using both the micro-porous membrane and the
ceramic disk with AEV of 500 kPa are shown in Figs. 6 to 10.


