1166
Proceedings of the 18
th
International Conference on Soil Mechanics and Geotechnical Engineering, Paris 2013
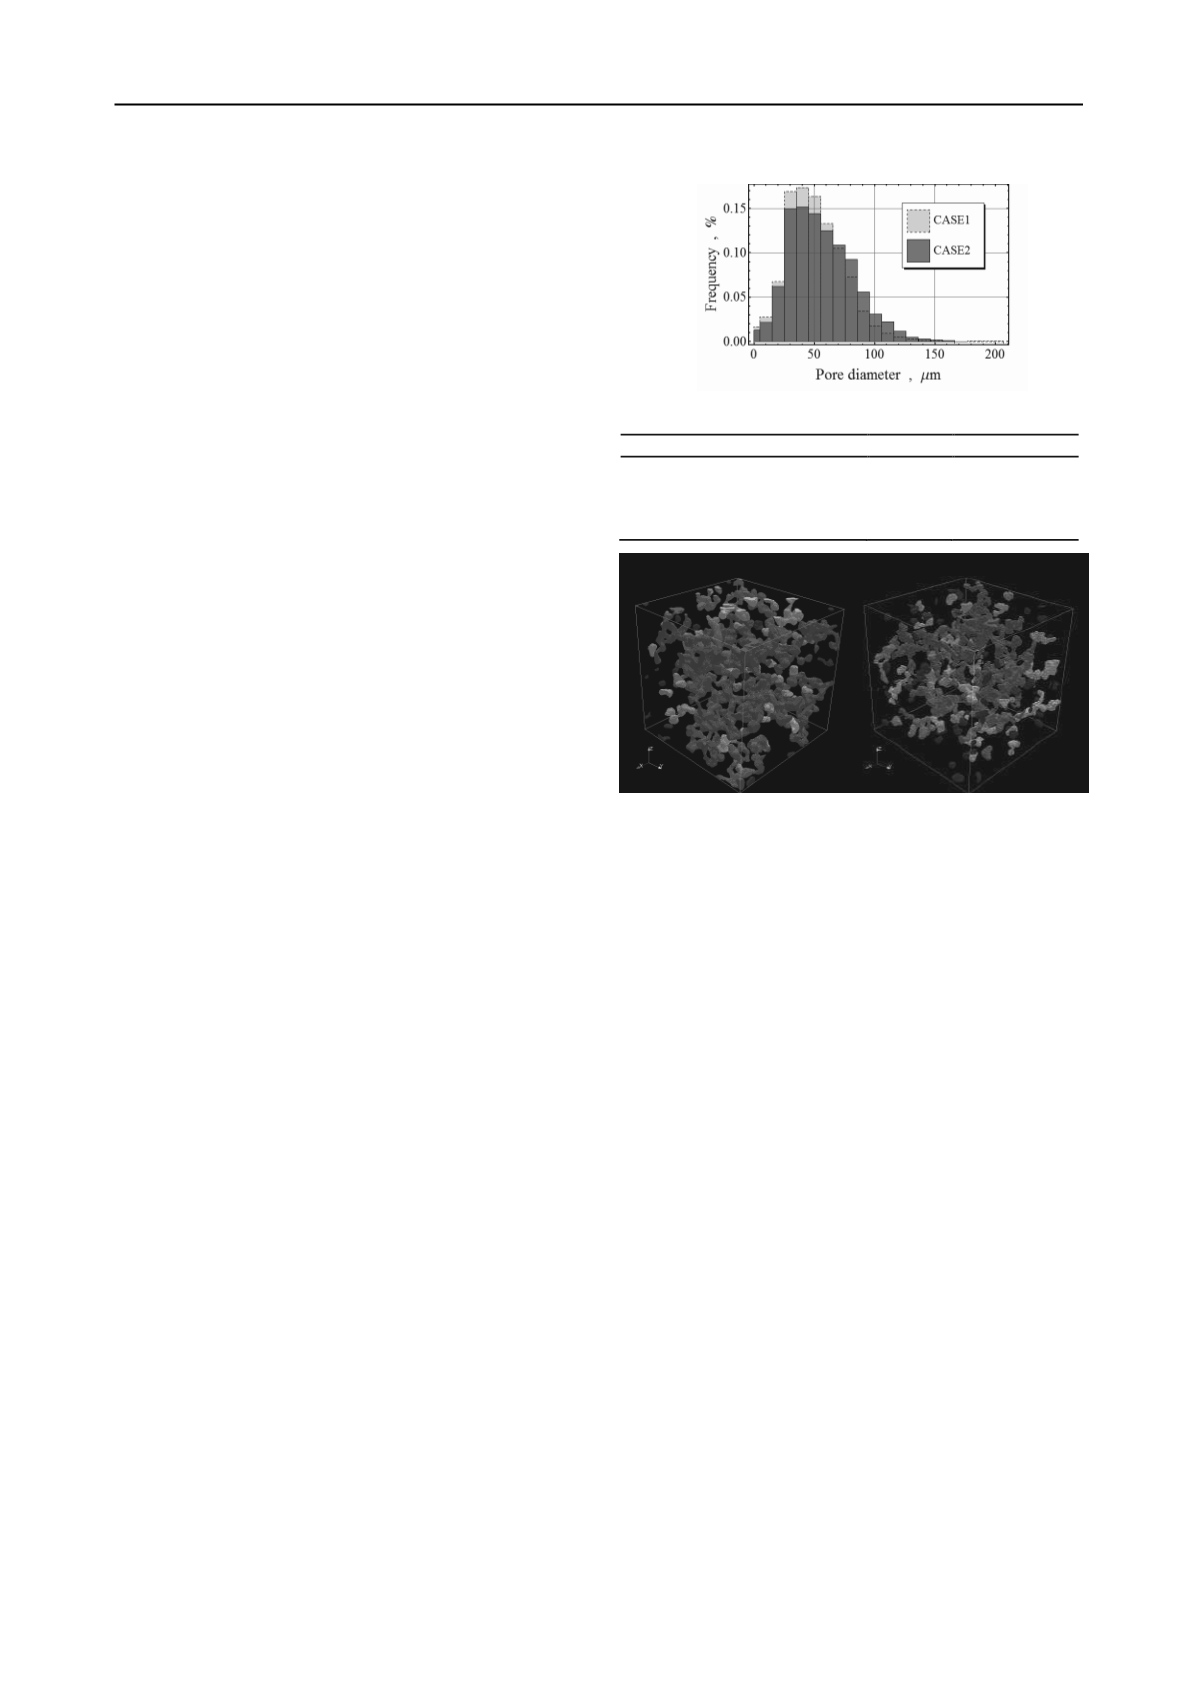
half for Case 1. Figure 11 shows 3D MXCT images of pore
structure isolated by mathematical morphology and cluster
analysis for Case 1 and Case 2. Cluster analysis of continuous
pore structure such as in soil materials allows defining pore
elements, allowing for their statistical analysis. In Figure 11,
the red cluster with greatest volume has a more complex shape
than the blue cluster with small volume, which is shaped like
balls. There were 99 LNAPL clusters isolated in Case 1 and 156
in Case 2, implying that fingering flow with capillary force
caused by LNAPL remained in wide area in the sample for Case
1. On the other hand, Case 2 with the capillary number (
Ca
)
twenty times greater than Case 1 reduced the capillary pressure
more than Case 1 as Mayer & Miller, (1993) discussed; and
hence, it can be concluded that the fingering flow with capillary
force was restrained.
3.5
Factor of LNAPL trapping
If LNAPL migrated in a single direction, water should be
almost completely flushed out. However, pore structure was
distributed in three dimensions, so pore structure connectivity
and a three-dimensional bottleneck effect should be considered
to evaluate residual LNAPL in the soil. In the case of sandy soil,
small changes in capillary pressure in excess of the entry
pressure significantly increased or decreased saturation. Factors
for trapping LNAPL are thus related to the connectivity of pore
structures and drastic changes in capillary pressure with
bottleneck effect. Besides,
Ca
would be related to the trapping
distribution in the sand as shown in Fig. 11 (a) and (b).
4 CONCLUSIONS
Sandy soil specimens were scanned by micro-focused X-ray CT
scanners, and spatial distribution of pore structures with
LNAPL were visualized and quantitatively evaluated by a
newly developed image processing technique using marker-
controlled watershed, a mathematical morphological method,
and cluster analysis. Key conclusions are as follows:
1) The developed thresholding technique worked well, and
allowed objective definition of locations with changing
greatest CT values without histogram analysis.
2) Factors for trapping LNAPL are related to the connectivity
of pore structures and drastic changes in capillary pressure
with bottleneck effect.
3) The capillary number (
Ca
) more than 10
-5
reduced the
capillary effect and residual LNAPL would be distributed
in local position. Meanwhile, the less
Ca
had dominant
flow with capillary effect so LNAPL was trapped in wide
area of sample.
5 ACKNOWLEDGEMENTS
This research was financially supported by a Grant-in-Aid for
Scientific Research (A) No. 23246156, for which Prof. Y.
Obara of Kumamoto University is a corresponding researcher.
The authors thank Mr. T. Sato of the Faculty of Engineering,
Kumamoto University, for his valuable support.
6 REFERENCES
Alkharusi, A. and Blunt, M.J. (2007): Network extraction from
sandstone and carbonate pore space images, Journal of Petroleum
Science and Engineering, Vol.56(4), pp. 219-231.
Altman, J. S., Peplinski, J. W. and
Rivers, L. M. (2005), “Evaluation of
synchrotron X-ray computerized micro tomography for the
visualization of transport
processes in low-porosity
materials”Journal of Contaminant Hydrology 78, 167–
183.
Dullien F.A.L. (1992), “Porous Media Fluid Transport and Pore
Structure”, ACADEMIC PRESS.INC. pp132
-138.
EPA/600/R-97/102 Environmental Protection Research Laboratory
October (1997) Agency Ada, OK 74820 vvEPA NAPL: Simulator
Documentation.
Mayer, A.S. and Miller, C.T.,
:
An Experimental Investigation of Pore-
Scale Distributions of Nonaqueous Phase Liquids at Residual
Saturation, Transport in Porous Media, Vol.10, 57-80, 1993.
Mualem, Y. (1976)
:
A new model for predicting the hydraulic
conductivity of unsaturated porous media. Water Resour. Res.,
12:512-522.
Mukunoki, T., Sugimura, K. and Mikami, M. (2010), Visualization of
LNAPL contamination in sandy soil using X-ray CT scanner, Proc.
of International Symposium on Earth Science and Technology
2010, pp.153-158.
Mukunoki, T., Mikami, K. and Sato, T. (2011), Image simulation of
wetting and drying process in sandy soils by
-focus X-ray CT
scanner, Proc. of the 2nd Japan-Korea Joint Workshop on
Unsaturated Soils and Ground, pp. 221-228.
Soille, P.
:
Moephological Image Analysis: Principles and Applications,
Springer-Vellag Berlin Heidelberg New York, 2002.
van Genuchten,M.Th (1980)
:
A closed-form equation for predicting
the hydraulic conductivity of unsaturated soil, Soil Sci.Soc.Am.J.,
Vol144, pp.892-898.
Wildenschild, D., Hopmans, J.W., Vaz, C., Rivers, M.L.,Rikard, D.,
Christensen, B.S. (2002), “Using X
-ray computed micro
tom
ography in hydrology: systems, resolution and limitations”, J.
Hydrol. 267, 285
–
297.
Wildenschild, D., Hopmans, J.W., Rivers, M.L., Kent, A.J. (2005),
“Quantit
ative analysis of flow processes in a sand using
synchrotron-based X-
ray microtomography”, Vados
e Zone J. 4,
112
–
126.
(
a) Pore with LNAPL in Case 1
Property
Case 1
Case 2
Initial LNAPL saturation (%)
80.08
83.14
Residual LNAPL saturation (%)
21.48
9.47
Cumulative pore volume at break
through
0.51
0.56
Fig
ure 10. Histogram of pore size for Case 1 and Case 2
(b) Pore with LNAPL in Case 2
Figure 11. 3D MXCT images of isolated pore structures
Table
3. Test results


