1162
Proceedings of the 18
th
International Conference on Soil Mechanics and Geotechnical Engineering, Paris 2013
Proceedings of the 18
th
International Conference on Soil Mechanics and Geotechnical Engineering, Paris 2013
APPENDIX A
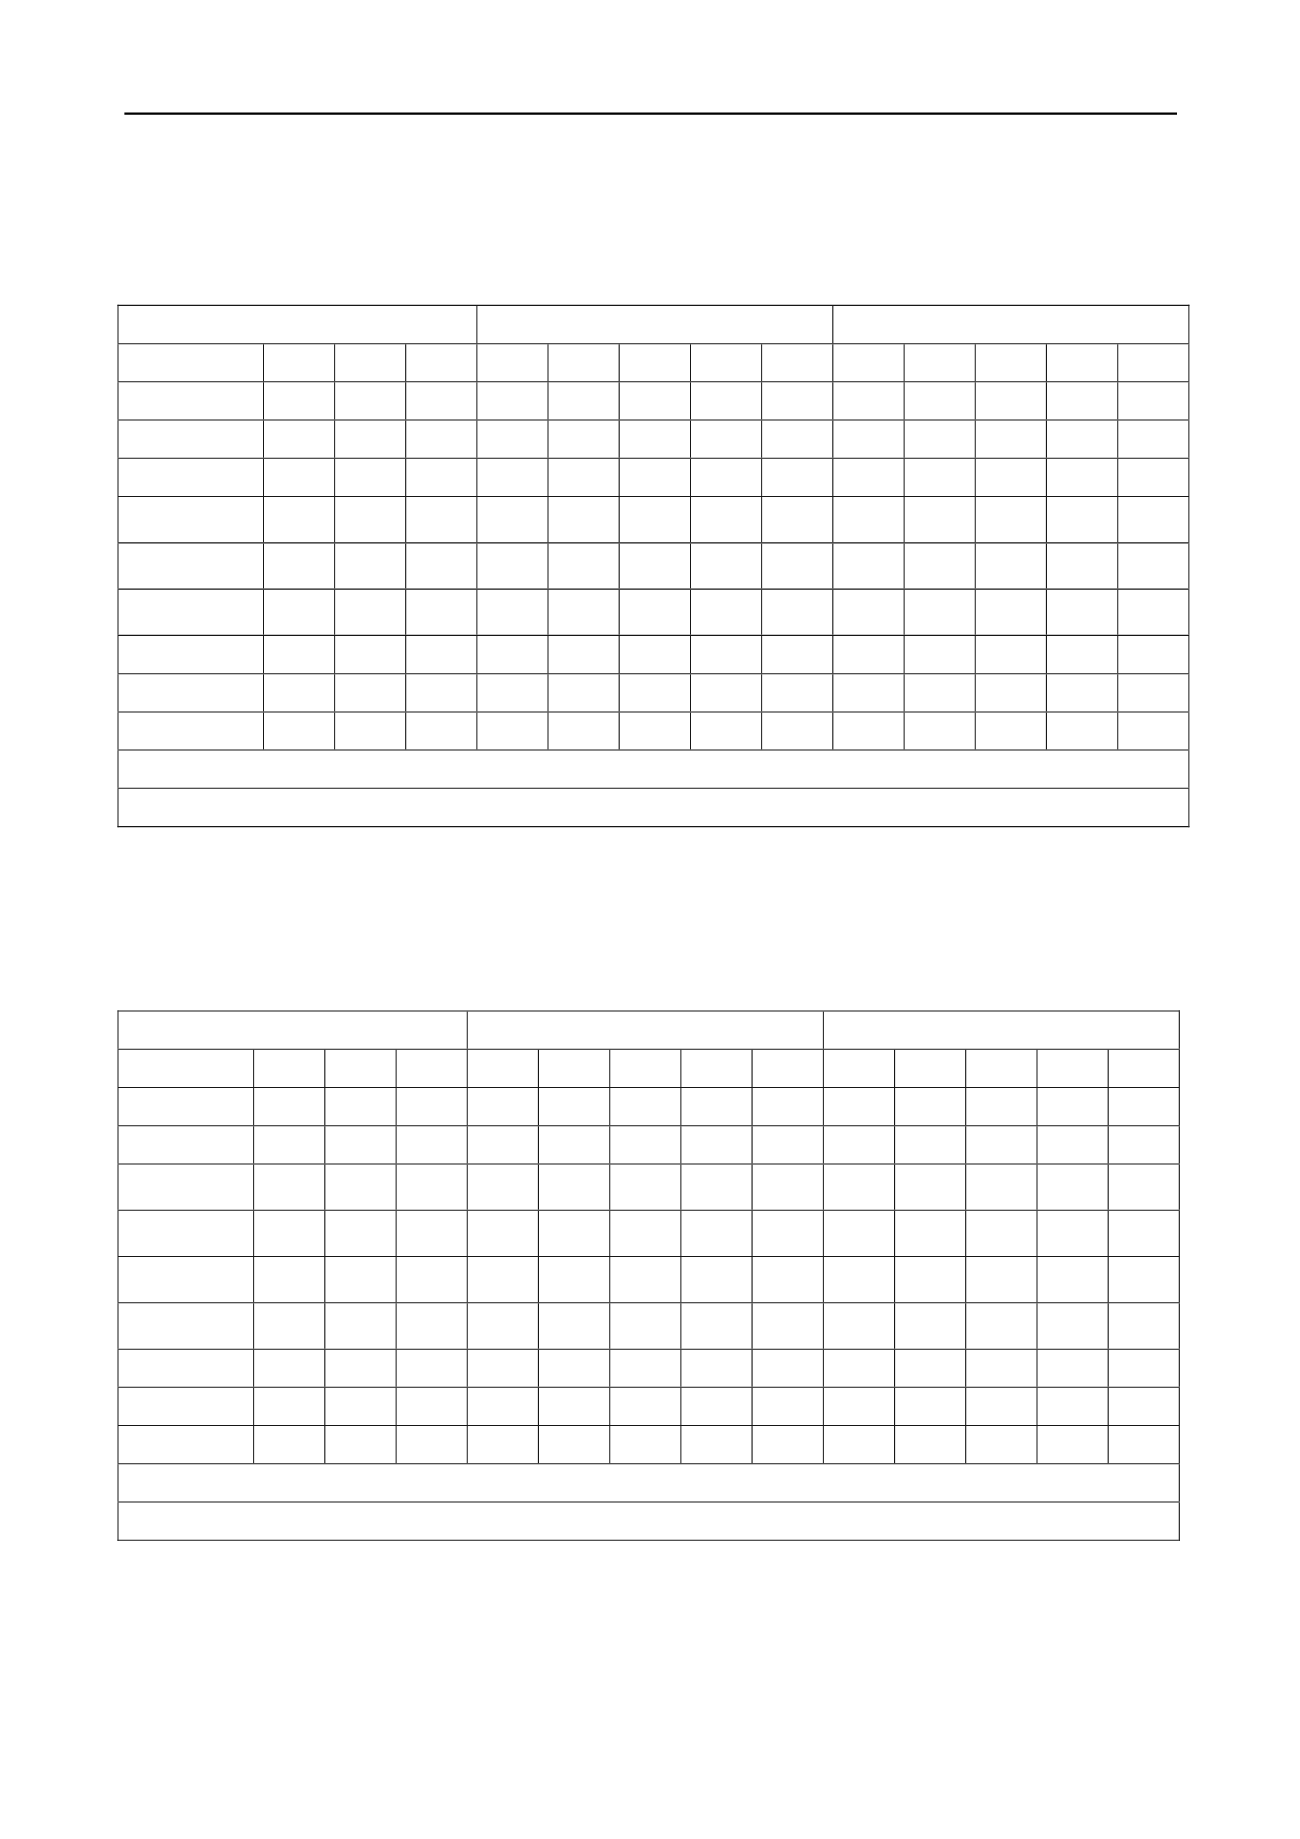
TABLE A1: DETERMINATION OF THE TMI FOR PERTH, AT PRESENT
Perth, Australia
Present Day
Latitude 31.95º S
Month
Jan Feb
Mar
Apr
May
Jun Jul
Aug Sep
Oct
Nov Dec
Total
Rainfall
9
13
19
46
123
182
173
135
80
55
22
14
871
Ave. temp (
t
)
24.3
24.7
22.8
19.9
16.7
14.0
13.3
13.4
14.9
17.0
20.3
22.7
Heat index (
i
)
10.95
11.23
9.95
8.09
6.21
4.75
4.40
4.45
5.22
6.38
8.34
9.88
89.86
Latitude
Corr. factor
1.21
1.03
1.06
0.95
0.91
0.84
0.89
0.95
1.00
1.12
1.15
1.23
Potential
evap. (
PE
)
137.4
120.8
106.2
72.8
49.4
32.2
30.8
33.4
43.3
62.9
91.6
122.1
903
Water
balance
-128.4 -107.8
-87.2
-26.8
73.6
149.8
142.2
101.6
36.7
-7.9
-69.6
-108.1
Storage
0
0
0
0
73.6
100
100
100
100
92.1
22.4
0
Deficit
128.4
107.8
87.2
26.8
0
0
0
0
0
0
0
85.7
435.9
Surplus
0
0
0
0
0
123.4
142.2
101.6
36.7
0
0
0
403.9
a = 1.970
TMI = 16
Notes on Table A1: Water balance = Rainfall – PE; Storage = previous month’s storage + water balance for month (= 0 if
result is negative, and =100 if result ≥ 100 mm); Deficit = |water balance| – storage
previous month
(if
storage for month = 0); and Surplus = water balance + storage
previous month
– 100 (if storage for month =
100).
TABLE A2: DETERMINATION OF THE TMI FOR PERTH, PREDICTED FOR 2070
Perth, Australia
2070
Latitude 31.95º S
Month
Jan Feb
Mar
Apr
May
Jun Jul
Aug Sep
Oct
Nov Dec
Total
Rainfall
7.9
11.4
16.7
40.5
108.2
142.0
134.9
105.3
58.4
40.2
16.1
12.3
694
Ave. temp (
t
)
27.2
27.6
25.5
22.6
19.4
16.3
15.6
15.7
17.8
19.9
23.2
25.6
Heat index
(
i
)
12.99
13.28
11.78
9.82
7.79
5.98
5.60
5.65
6.84
8.10
10.21
11.85
109.9
Latitude
Corr. factor
1.21
1.03
1.06
0.95
0.91
0.84
0.89
0.95
1.00
1.12
1.15
1.23
Potential
evap. (
PE
)
174.6
154.0
130.8
87.4
57.8
35.0
33.3
36.1
51.6
75.7
112.8
153.2
1102
Water
balance
-166.7 -142.5 -114.0
-47.0
50.4
107.0
101.6
69.2
6.8
-35.5
-96.7
-140.9
Storage
0
0
0
0
50.4
100
100
100
100
64.5
-32.3
0
Deficit
166.7
142.5
114.0
47.0
0
0
0
0
0
0
0
173.1
643.3
Surplus
0
0
0
0
0
57.4
101.6
69.2
6.8
0
0
0
235.0
a = 2.427
TMI = -14
Notes on Table A2: From Table 1 for Perth in 2070, predicted monthly rainfall decrease below present day averages is
12% for summer (i.e. December to February), 12% for autumn (i.e. March to May), 22% for winter
(i.e. June to August) and 27% for spring (i.e. September to November). Also from Table 1, the
predicted average monthly temperature increase over present day averages is 2.9°C for summer,
2.7°C for autumn, 2.3°C for winter, and 2.9°C for spring.
4


