1157
Technical Committee 106 /
Comité technique 106
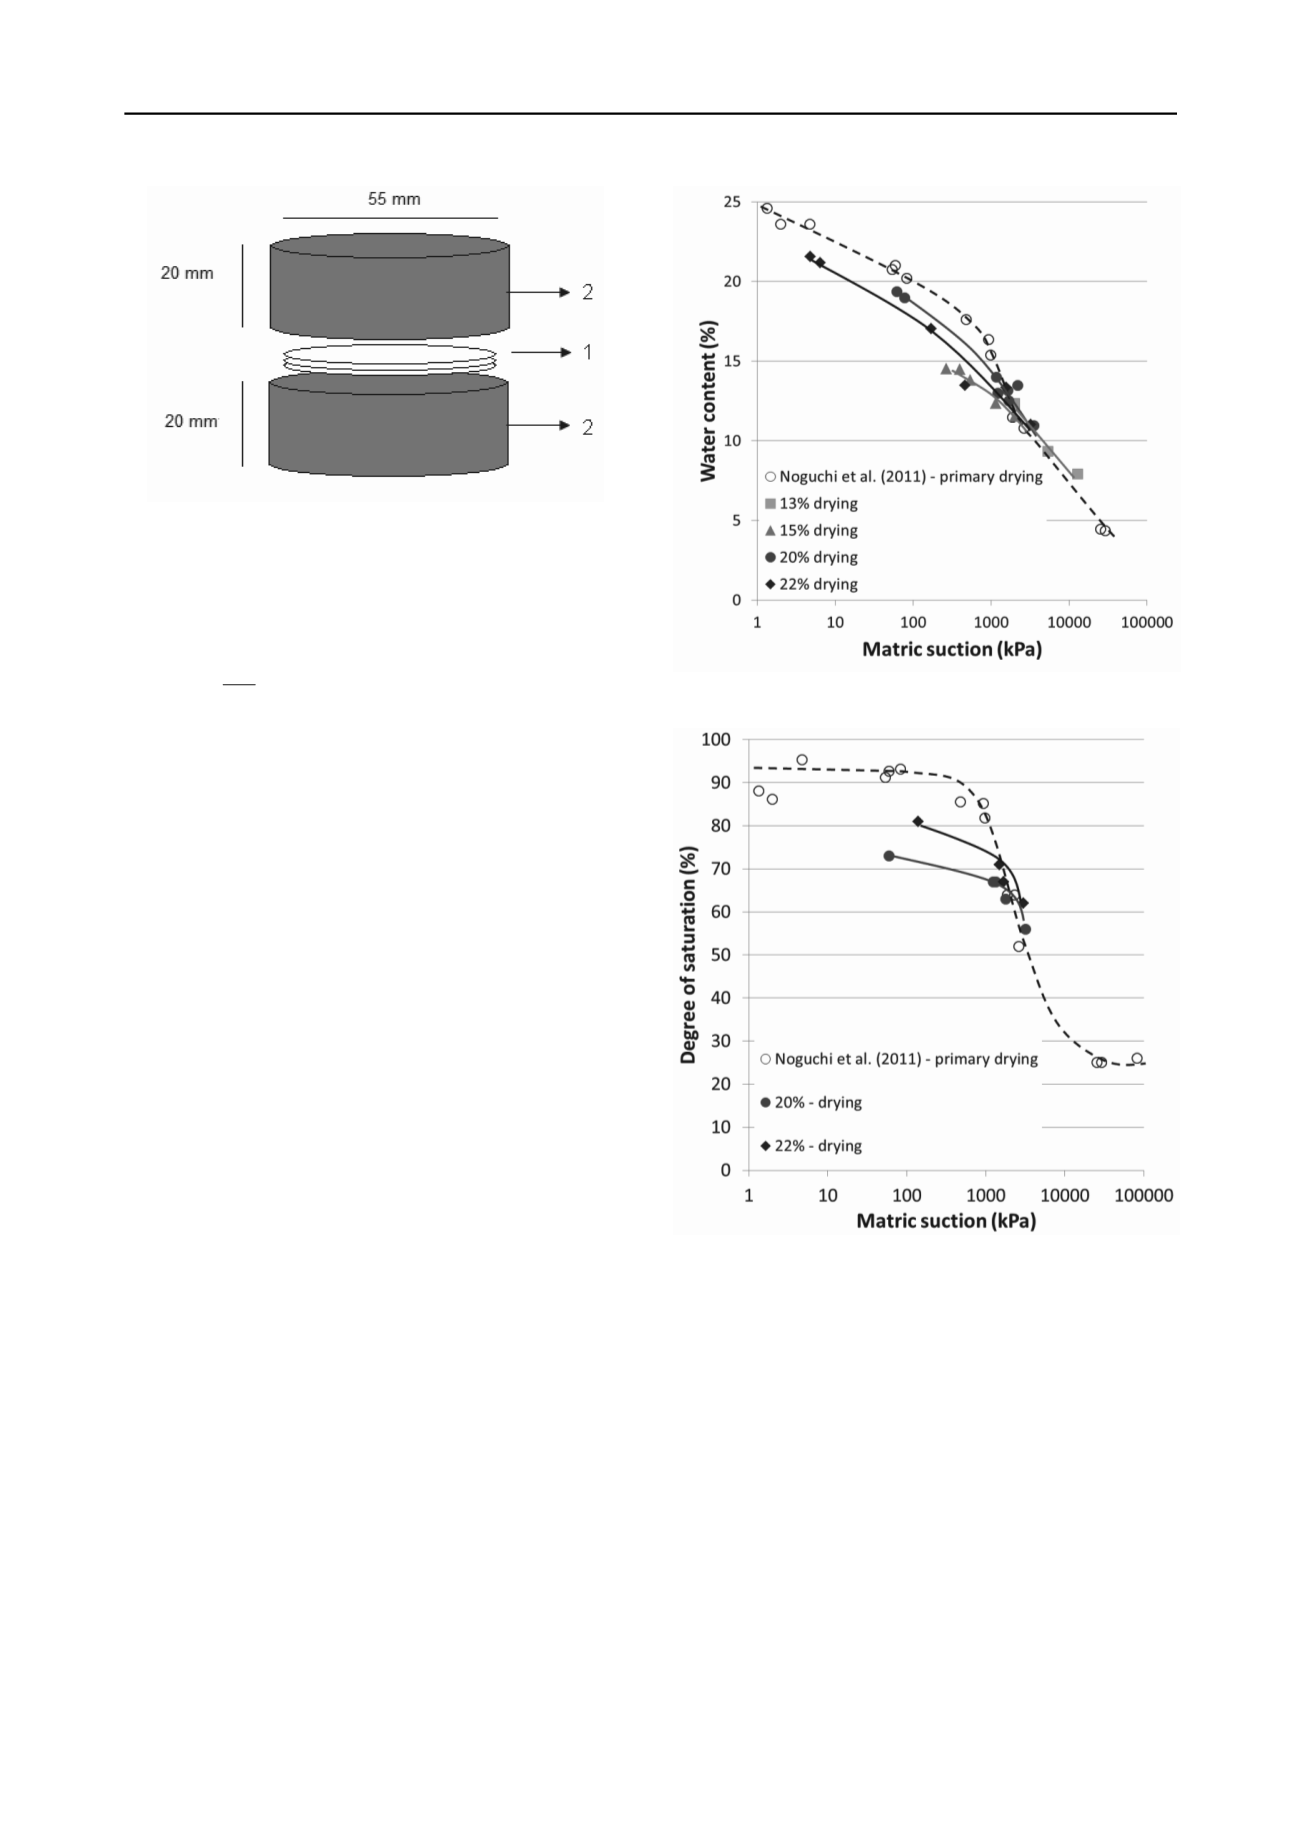
Legend:
1 – contact filter paper;
2 – soil sample disc.
Figure 4. Schematic of the filter paper technique (adapted from Bulut et
al., 2001).
473 .0
615 .9
1
248
051 .0
f
w
(1)
where Ψ = soil suction (kPa)
w
f
= filter paper water content (%).
3 RESULTS AND DISCUSSION
The suction measurements obtained for the different water
contents, along with the soil water retention curve (SWRC)
following the primary drying path obtained by Noguchi et al.
(2011), are presented in Figures 5 to 8. The primary drying
SWRC obtained by Noguchi et al. (2011) was obtained from
samples prepared initially at 25% of water content, close to a
fully saturated state. As shown in Figures 6 or 8, the primary
drying SWRC has the typical shape of a bimodal function.
3.1
SWRCs following drying paths
Figure 5 shows the best fit curves obtained for the SWRCs at
different initial water contents following drying paths. It is clear
from Figure 5 that the obtained curves are initially lower than
the primary drying curve obtained by Noguchi et al. (2011) for a
specimen prepared at 25% water content. However, later, at
around 10-11% of water content, or 1500-2000 kPa of suction,
it can be observed that the curves converge to the primary
drying SWRC. This suggests that the SWRC of soils compacted
at lower water contents follow drying paths that are very like
the behaviour of scanning curves.
Figure 6 shows the matric suction SWRC following drying
paths in terms of the degree of saturation. Due to changes in
methodology, volumetric measurements were only obtained in
tests for initial water contents of 20% and 22%. Comparing
them with the primary drying curve obtained by Noguchi (2011)
the two curves 20% and 22% initially fall under, but later
converge with the primary curve.
These results show many of the features identified in the
conceptual model for drying proposed by Toll (1995). As
suggested by Vanapalli et al. (1999), there is a higher resistance
to desaturation (flattening of the SWRC) with decreasing initial
water content.
3.2
SWRCs following wetting paths
The behaviour of the SWRCs obtained following wetting
paths, however, shown untypical behaviour. As is observed
from Figure 7 the SWRCs that followed a wetting path moved
Figure 5. SWRCs following a drying path for all water contents.
Figure 6. Suction-degree of saturation relationship for all SWRCs
following drying paths.
towards the primary drying curve, rather than towards the
primary wetting curve. Although the primary wetting curve was
not determined, the impression is that the behaviour of the
wetting SWRCs seems different to that expected. The SWRCs
seem to cross the primary drying curve in an ascending form,
where the SWRC obtained from 10% of water content was the
first to cross at 300 kPa of suction followed by the SWRC for
the water content of 13%, 15% and so on.
Similar results were observed in the matric suction – degree
of saturation relationships for the SWRCs show in Figure 8. The
lack of tests where volumetric measurements were obtained was
not sufficient to fully understand the behaviour of the SWRCs
that followed a wetting path. However, a general trend of the
SWRCs was observed in Figure 8 where the SWRCs
overlapped each other. However, it has to be remembered that
samples compacted at lower water contents will have different
soil fabrics. It seems this is more significant in affecting the
wetting behaviour than the drying.


